In the 4/17/17 Market Update I wrote of a low-low-high interval pointing to a high on 5/11/17.
The lows of July 8, 1932 and December 9, 1974 were arguably the two most important lows of the 20th century. They lie 15,494 days apart. Adding an additional 15,494 days to the 1974 low points to a high on May 11, 2017.
In the 4/24/17 Market Update I wrote of a Hybrid Lindsay forecast pointing to a high in the period May 8-11.
The Hybrid Lindsay model confirms that forecast for a high in the Dow near May 11. The Hybrid model points to inflections points of both major and minor highs and lows so it does NOT confirm the low-low-high forecast for a major high – only that we should see a decline of unknown degree start near that time period.
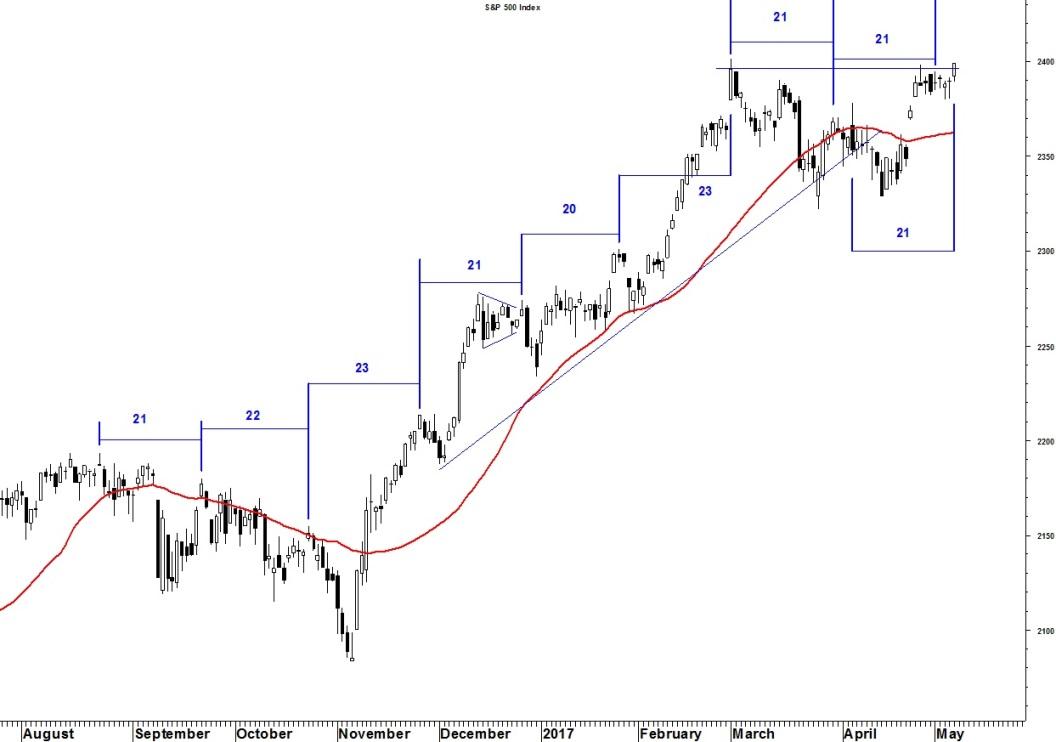
There have been a handful of instances in the past when the Hybrid model forecast both a high and a low on or near the same date. Checking the forecast for a low uncovered the same anomaly for the May 8-11 time period. I’m leaning heavily toward the original forecast for a high – not just because of the low-low-high interval forecast – but because the patterns pointing to a high are “cleaner” than the patterns pointing to a low and a 21-day cycle points to a high today (chart). Either way, an inflection point is due this week.

