🧐 ProPicks AI October update is out now! See which stocks made the listPick Stocks with AI

Equity Volatility Nearing 'Critical Mass'

Published 02/04/2018, 12:16 AM
Updated 07/09/2023, 06:31 AM
US500
-
VIX
-

I last wrote about the S&P 500:VIX ratio in my post here.

The SPX continued its plunge (that began on January 30) and closed near its low on Friday (spiking the VIX to a new daily swing high), as noted in this post.

The following monthly chart of the SPX:VIX ratio shows that price closed well below, what was, major support of 200 and is hovering just above the 150 Bull/Bear Line-in-the-Sand or "critical mass."

Furthermore, the momentum indicator has fallen below the zero level, hinting of further equity weakness to come in the longer term.

If this ratio drops and holds below 150, no doubt we'll see an acceleration of equity selling and much higher spikes in volatility. In any event, we'll continue to see some wild swings as long as this ratio stays below 200.
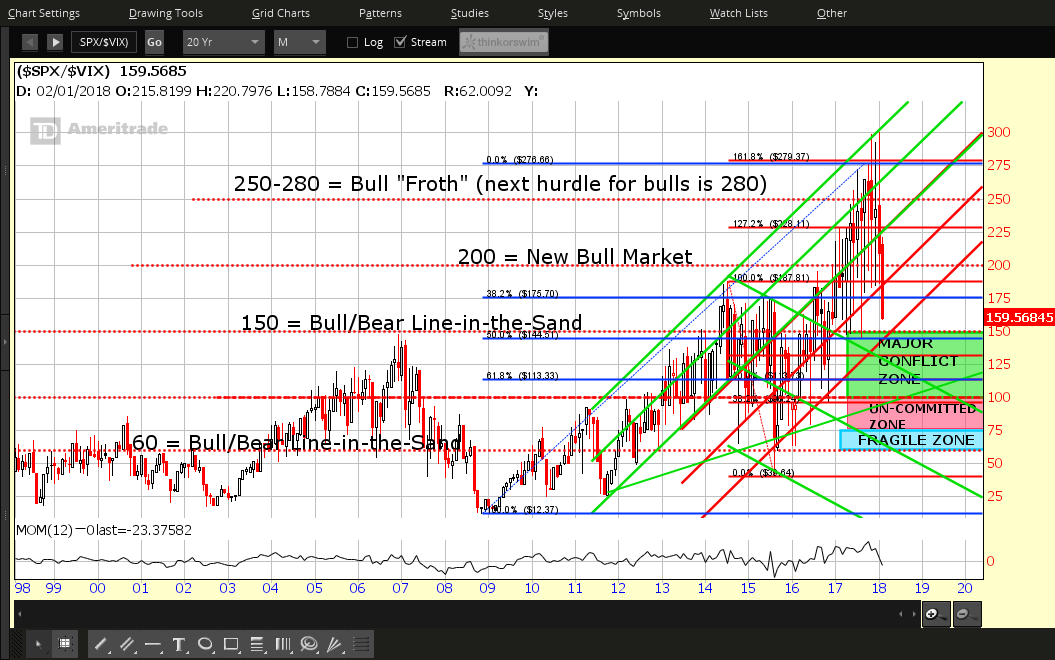
SPX:VIX Monthly 1998-2018

As well, watch for a bearish moving average crossover of the ratio 5MA and 20MA on the following monthly chart -- which shows the SPX in the upper half and the SPX:VIX ratio (in histogram format with these 2 moving averages) in the lower half—if the ratio were to drop and hold below 150, to confirm continued (and, potentially, panic) selling in the SPX.
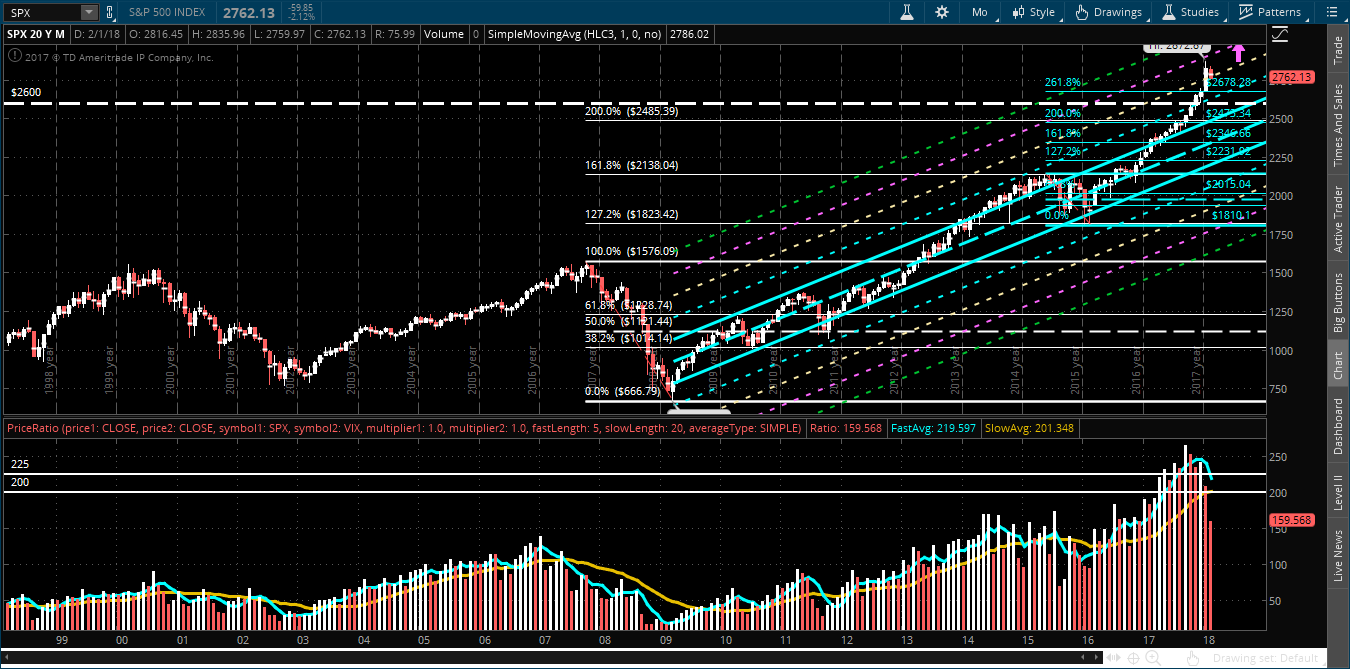
SPX vs SPX:VIX with 5 and 20 DMA 1998-2018

Latest comments

Loading next article…
Risk Disclosure: Trading in financial instruments and/or cryptocurrencies involves high risks including the risk of losing some, or all, of your investment amount, and may not be suitable for all investors. Prices of cryptocurrencies are extremely volatile and may be affected by external factors such as financial, regulatory or political events. Trading on margin increases the financial risks.
Before deciding to trade in financial instrument or cryptocurrencies you should be fully informed of the risks and costs associated with trading the financial markets, carefully consider your investment objectives, level of experience, and risk appetite, and seek professional advice where needed.
Fusion Media would like to remind you that the data contained in this website is not necessarily real-time nor accurate. The data and prices on the website are not necessarily provided by any market or exchange, but may be provided by market makers, and so prices may not be accurate and may differ from the actual price at any given market, meaning prices are indicative and not appropriate for trading purposes. Fusion Media and any provider of the data contained in this website will not accept liability for any loss or damage as a result of your trading, or your reliance on the information contained within this website.
It is prohibited to use, store, reproduce, display, modify, transmit or distribute the data contained in this website without the explicit prior written permission of Fusion Media and/or the data provider. All intellectual property rights are reserved by the providers and/or the exchange providing the data contained in this website.
Fusion Media may be compensated by the advertisers that appear on the website, based on your interaction with the advertisements or advertisers.
© 2007-2024 - Fusion Media Limited. All Rights Reserved.