This week, one of the key themes for me will be trading around a low volatility environment.
I would advocate selling volatility through optionality structures, but value is poor because implied volatility is already quite low. I feel this is going to be a week of allowing markets to go through the motions and waiting for new information, from which traders can then look at fresh opportunities. Until then, I would look at playing ranges in FX, developed market indices and fixed income, although there will continue to be more pronounced opportunities – specifically in Australian equities.
Last week, all the market chatter was around the evolution of the People’s Bank of China’s (PBoC) fixing mechanism. Many traders would have learnt a lesson on how the ‘fix’ worked in the first place, and the impact a longer term depreciation in the CNY means for China’s competitiveness and import demand. However, after today’s modestly stronger CNY fixing and some supportive views from the IMF and US treasury, it seems we can move on and focus firmly back on the Chinese equity market – which is modestly lower today.
The ASX 200 has found some signs of life after last week’s 2.2% drop, however, the technicals and internals should keep traders cautious. Last week’s break of the 2012 uptrend and the subsequent close below the July lows of 5383 are significant; they signal that trend and momentum should suggest selling rallies in the index. The bulls had a chance to push the market back through 5383 today, but failed. Again, this is bearish.
ASX 200 implied volatility is actually still quite elevated, with the ASX 200 VIX at 19%. However, as we have seen over the last 12 months, moves above 20% seem to be levels where traders will sell volatility.
Aussie earnings season is actually quite good if we only take the level of beats and misses. Outlook statements haven’t been terrible, but money managers would have liked to have seen more inspiring rhetoric, and we are more likely to have seen net downgrades of forward EPS assumptions from analysts. Still, we have seen 26% of the ASX 200 report, with 56% having beaten the analysts’ consensus estimates on EPS and 55% of revenue. We have also seen 6.1% earnings growth, which is certainly better-than-expected.
What is the next catalyst for the market to move higher? This is the tough question, especially when even after a 6% decline, the index is still trading on a premium to the long-term average. It’s hard to see what would take us to 6,000 this year, when the Reserve Bank looks set to keep its policy setting at 2%, and there are question marks surrounding low inflation in global economies.
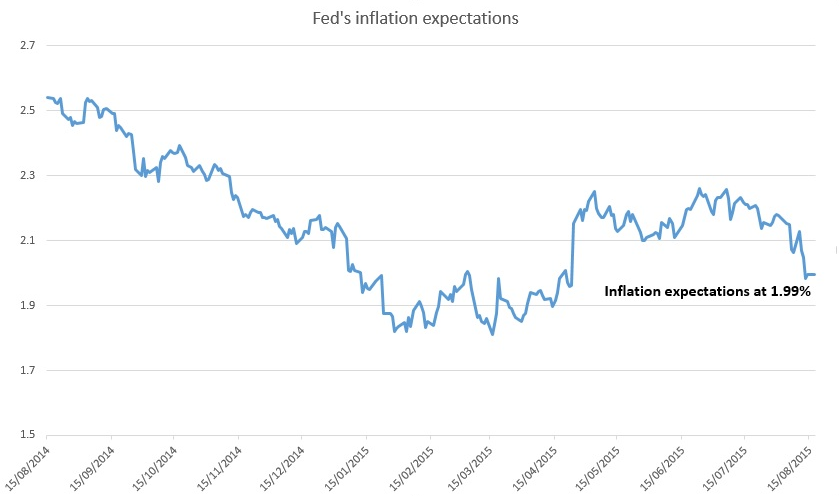
The focus, then, has shifted back to the Fed, with the argument firmly focused on how the US central bank will raise in September when inflation expectations are falling. Oil is largely to blame, and it’s interesting looking at five-year forward five-year breakevens (the Fed’s preferred measure of inflation expectations – see below) dropping below 2% for the first time since April. There is a case to suggest that the Fed should hold-off raising when inflation expectations are approaching similar levels to the March FOMC meeting, when the central bank cut its dot plot projection marking a high in the USD. Interestingly, the trade-weighted USD (the Fed’s preferred measure of the USD) is also back to testing similar levels as March.

If the Fed was concerned with the dynamics of falling inflation expectations amid a rising USD, then we’re back to the same headache we had in March. The market seems much more nuanced this time around though, with two-year yields once again primed to break 75 basis points.
The implied probability of September is currently 48%, which seems fair, and the data out this week (on core CPI, housing starts, existing home sales, leading index, and FOMC minutes) shouldn’t alter that argument to any great degree. Fed presidents Williams (centrist) and Kocherlakota (extreme dove) are also due to speak, and San Francisco president John Williams’ comments will be most interesting, given the slight hawkish shift in language recently from Dennis Lockhart (also a centrist).
The Relative Strength Index (RSI) on EUR/USD, US dollar index, GBP/USD and S&P 500 are close to 50. This highlights that a number of markets closely influenced by pricing around the Fed lack a catalyst for short-term direction. This plays into my idea of range trading, and the view that volatility is likely to stay low this week. On this week, I like:
Selling EUR/USD into $1.1200, with long positions into $1.1014
Selling AUD/USD into $0.7450, with a first target at $0.7350, then $0.7250.
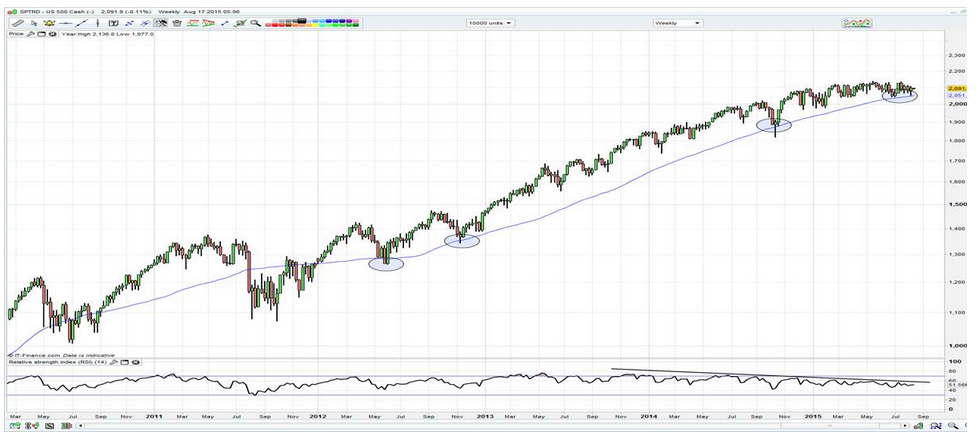
Becoming more bearish on the S&P 500 on a weekly close below the 55-week moving average at 2,051. As you can from below, this average has defined the trend for a number of years.

