As far as US earnings go, today is one of the key dates, although it’s the after-market that will garner traders’ attention with Apple (NASDAQ:AAPL) reporting.
There has been minimal net buying of US futures during Asian trade, with IBM (NYSE:IBM) (-5.3% in post market trade) providing a reasonable headwind as traders look at the sheer lack of catalyst to drive the name higher. Asian bourses have also failed to convince futures traders to act,. The S&P/ASX 200, however, continues to work well for the bulls and, at the time of writing, is above the June high of 5705. The financial and healthcare sectors look bullish on the daily charts and are showing huge leadership here in Australia – stay long these sectors.
It still feels like the calm before the storm and if there is one company that has the pedigree to make a mockery of sell-side earnings forecasts it’s Apple. The tech giant has beaten EPS forecasts for eight consecutive quarters and revenue for seven of the last eight, so there really is no stock you would rather be holding during what is a risky time to be long stocks.
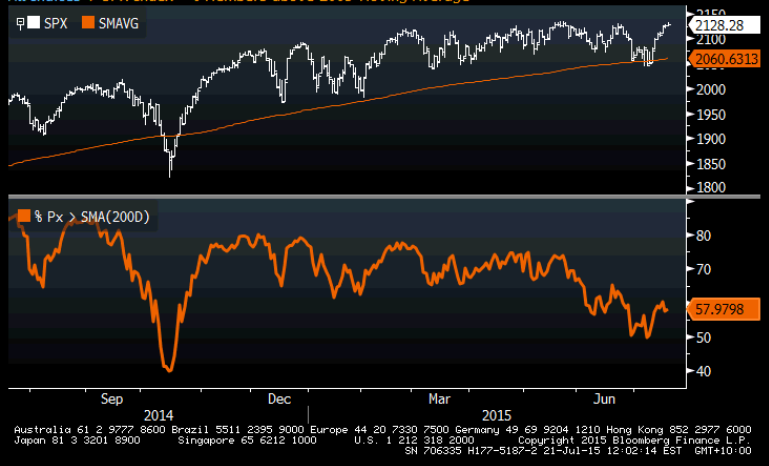
Good numbers from Apple and we could well be talking new highs in the S&P 500, although there has been some focus on the poor market breadth during this move, with only 57% of stocks above the 200-day moving average. If we do see a new high then it will be on the least positive breadth during the multi-year bull market. Still, onwards and upwards with a renewed focus on the translation effect of a strong USD, notably after IBM took a big currency hit.

With that in mind, and as discussed in prior reports, the moves in the USD are now the central focus of global capital markets. The real backbone behind this is the US bond market – specifically the US two and five-year treasury bond. The front end of the US yield curve is the key driver and if you look at the yield spreads against various counties you can see the influence here:
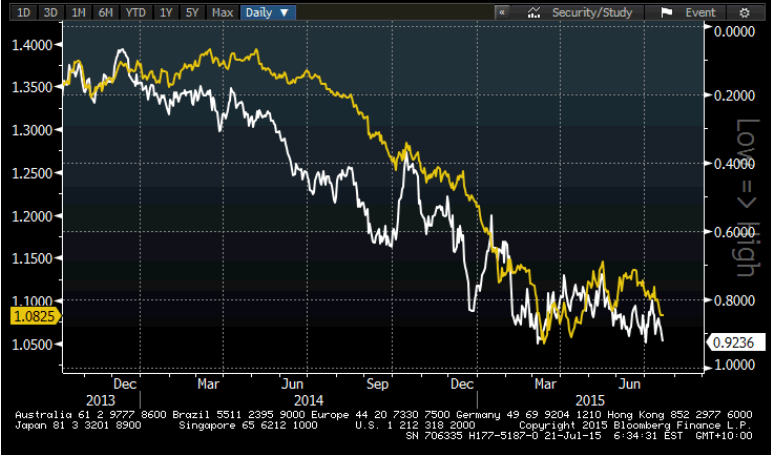
EUR/USD – The yield premium the US treasury commands over the German bund has blown out to a record 92 basis points. This is hugely positive for the USD valuation. If it weren’t for the fact the Eurozone had been running a current account surplus since mid-2011, then EUR/USD would absolutely be closer to the year’s lows of $1.0458. As detailed yesterday I would be looking at short positions on a close through the May pivot (and double top neckline) of $1.0819 for a move into $1.0450.

AUD/USD – The pair has fallen today after the RBA minutes did little more than reiterate the meeting statement. The real catalyst is tomorrow though with Q2 CPI and Glenn Stevens’ speech (13:05 aest). Rallies in AUD/USD should be contained $0.7400 to $0.7450, however, the current yield spread suggests the downside may be limited. The correlation between the AUD/USD and the commodity index is also (as you’d expect) very strong.
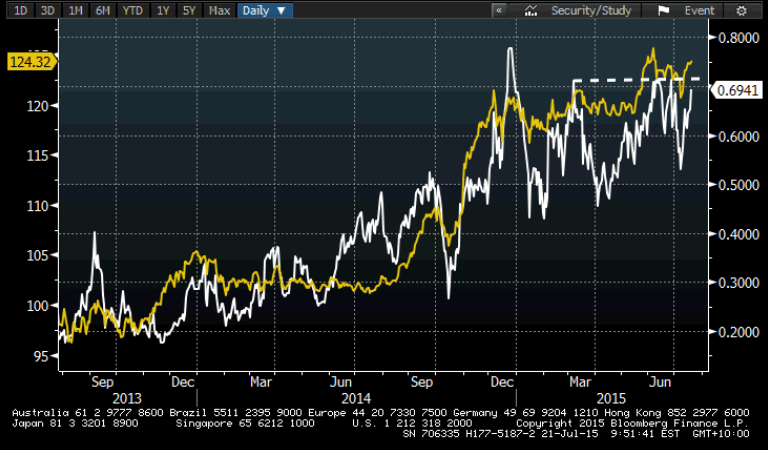
USD/JPY – The pair has broken and closed above the 61.8% retracement of the June to July sell-off (¥123.78) and a move into the ¥125.00 looks likely over the next week or two. Pullbacks look like very compelling opportunities. However, the bond market is again the centrepiece. The yield premium that investors are demanding for US 2-Year treasuries over Japanese 2-Year treasuries has widened to 69 basis points and a break of the 70 level could encourage further capital flows out of Japan and into the US. The Nikkei 225 looks bullish – stay long as a hedge against Fed normalisation.

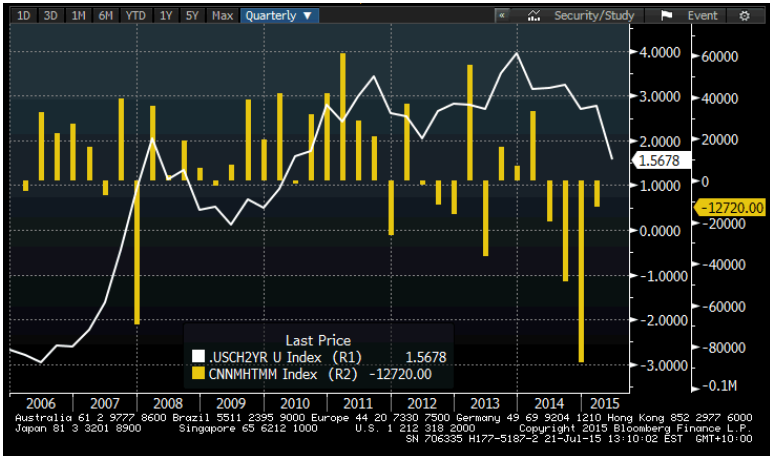
USD/CNY – With the market celebrating ten year anniversary of the end of the USD/CNY peg, it is always interesting to look at the influence of the bond market on capital flows. If we look at the spread between the China and US 2-year bond yields, you can see that as the premium decreases (i.e. Chinese yields move more aggressively lower than US bond yields) we see capital leave China and presumably make a home in the US as the expected returns in the US increase. This is a significant USD positive and if it weren’t for the People’s Bank of China maintaining stability in the CNY, then the CNY would be significantly weaker.

The market may be getting quite excited about the Fed putting up rates and you can see the move higher in the regression channel of the two-year US treasury. It suggests that yields should continue to move higher (prices lower) and therefore the USD should continue to find buyers. In turn, a bearish stance on resources would be warranted. Perhaps the key saving grace for many commodities, specifically gold, is that everyone is now bearish. It doesn’t, however, feel like we have reached the height on bearishness yet.
