September this year certainly seemed like an odd month. For example, the fifth business day of the month was Tuesday, September 10 as Labor Day in the U.S. was on Monday September 3. The first business day was September 4. The end of the month is this Friday, September 28. I mention this as the Presidential cycle is getting more attention since the mid term elections are a little more than a month away. So how does the equity market perform in the second year of the presidential cycle?
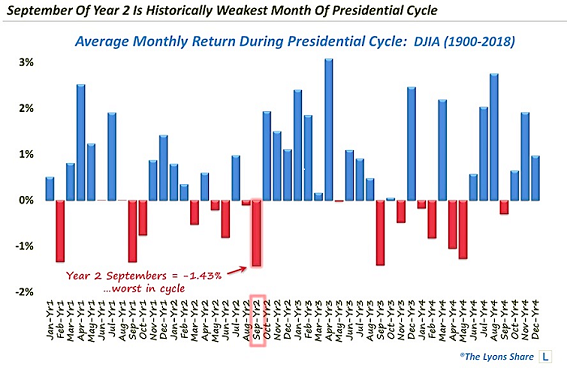
The performance in year two of the Presidential cycle can be evaluated on either a monthly basis or quarterly basis. How far back in time one goes matters too but I will let others debate that. Below is a look at the monthly returns for a four year cycle. Dana Lyons frequently provides good analysis on various market data as he has done with the below chart.

Dana's data goes back to 1900 and shows the month of September (year 2 in the presidential cycle) is the worst month of any during a president's four year term. As fate might have it, and three days are left before month end though, the S&P 500 Index is up .6% on a total return basis and the Dow Jones Industrial Average Index is up 2.1% month to date. This is far better than the historical average of down 1.43% for the Dow Index in September.
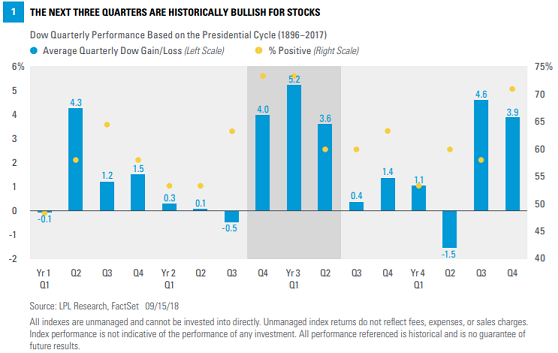
On a quarterly basis, the third quarter of the second year of the presidential cycle is the second worst quarter in the four year presidential cycle, down .5% based on data going back to 1896. LPL Research published a Midterm Mayhem report that contained the below chart.

With three days left before the ending of the third quarter, the S&P 500 Index is up 7.74% on a total return basis and the Dow Jones Industrial Average is up 9.77%.
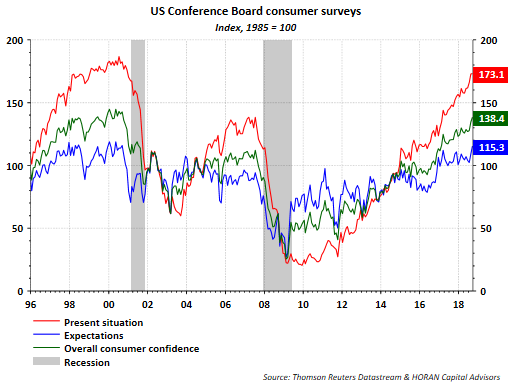
For investors, it is tough to time the market. And although September and the second quarter are performing far better than historical data would suggest, the market's return into year end might remain strong as well. Companies continue to report very strong earning as I have noted in recent blog articles, confidence of consumers and business remains very strong as well. Further evidence of this is today's report on consumer confidence from the Conference Board. The overall index was reported at a strong 138.4 which surpassed consensus expectations of 131.7. This is the highest reading in 18 years and is approaching the record high of 144.7.

I have also noted in the past, one should not confuse viewpoints on politics with one's views on equity market returns. The equity market did fine under President Obama and has done well under President Trump. As both charts above show, the months and/or quarters following midterm election years tend to be mostly positive ones. At the end of the day it is the economy that matters.
