It was a case of continuing Friday’s theme for the Asian session, though activity was muted and liquidity slightly strained due to a Japan holiday. A strong US jobs report for October, upward revisions to September and an unemployment rate that matched expectations were the catalysts to power US equities higher on Friday, with the advance extending into today as the SPX500 and NAS100 indices both hitting record highs. The US30 index was a bit of a laggard but still managed to reach the highest levels since July 25.
South Africa’s double boost
Not only did South Africa win the 2019 Rugby World Cup at the weekend (apparently on a 12-year cycle and deserved, says this Englishman) but ratings agency Moody’s spared the nation’s sovereign rating a downgrade to junk status late Friday. There were fears of a downgrade amid a gloomy mid-term budget statement last week, which saw the 2019 growth forecast slashed to 0.5% and government debt racing away.
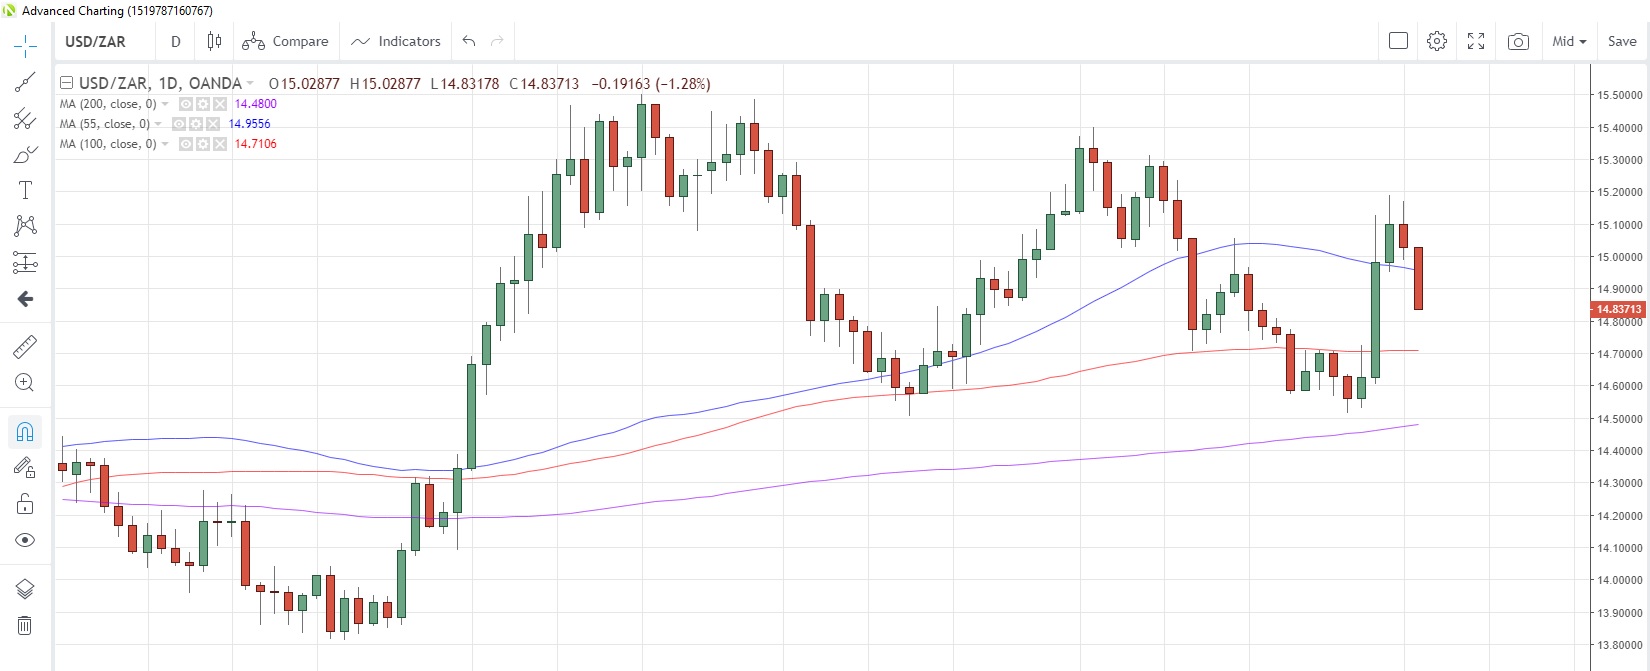
Moody’s cited those two reasons for a downgrade to its outlook for the South Africa rating to negative, which is normally seen as a precursor to an actual downgrade further down the line. The South African rand responded positively to the news, with US/ZAR falling 1.27% to 14.837 in Asia today, the biggest drop in more than three weeks as the FX pair fell to the weakest since Wednesday.
USD/ZAR Daily Chart

Australia’s retail sales decelerate
Growth in retail sales in the land down-under slowed to +0.2% m/m in September, as expected but a slowdown from August’s +0.4% pace, which was the highest in six months. Disappointing ANZ job advertisements for October, a 1.0% drop from September, added to the lackluster tone but these two data points are unlikely to pressure the RBA to cut rates at tomorrow’s rate meeting.
Indeed, interest rate markets are pricing in almost no chance (just a 6.0% probability) of a 25 bps cut at tomorrow’s meeting, though Australian press there may be some minor changes in the wording of the policy announcement, possibly regarding the 2%-3% inflation target.
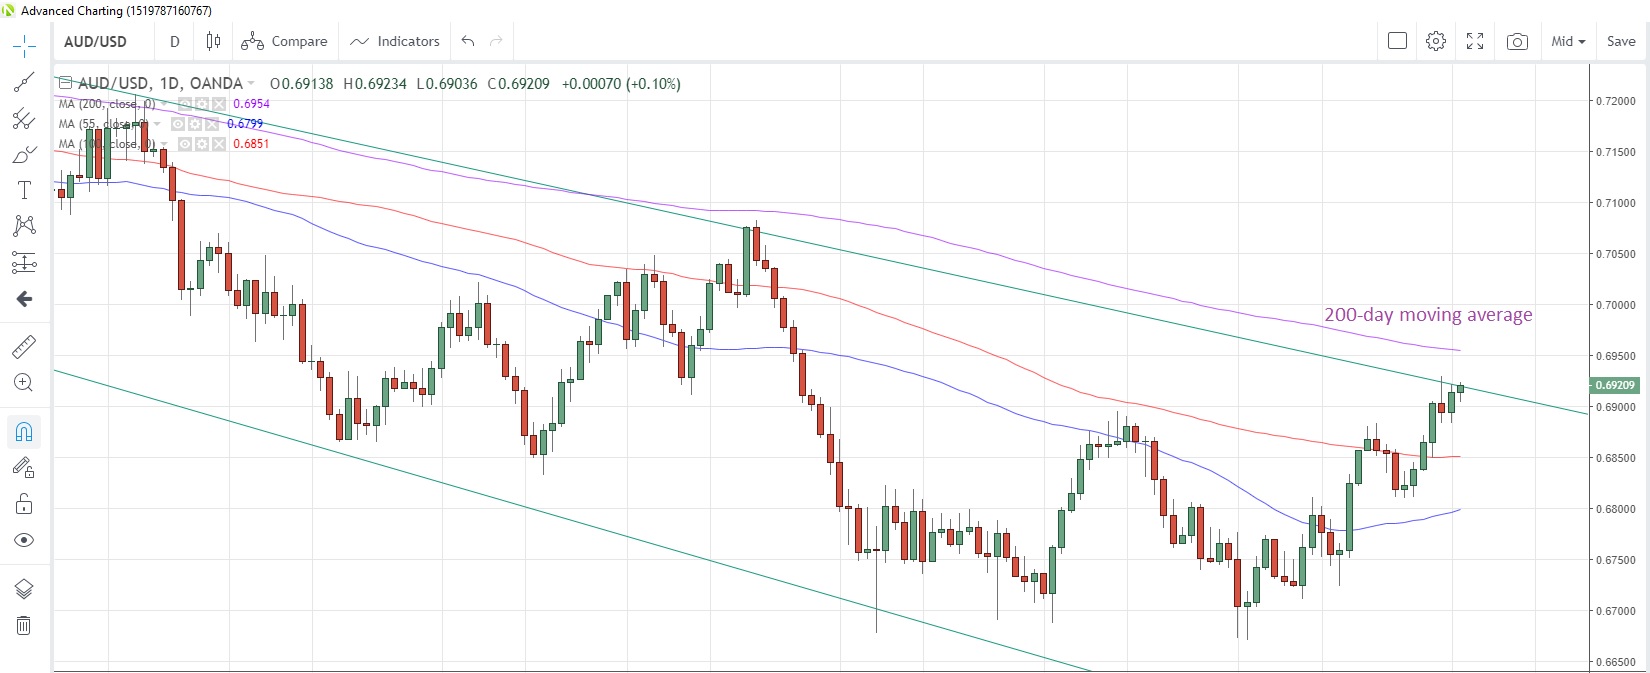
AUD/USD has been steady this morning, trading in a tight 0.6903-23 range. The 200-day moving average is at 0.6954.
AUD/USD Daily Chart

The PMI data flow continues
After the US PMIs were released Friday, both the Markit and ISM versions, it’s now the turn for Europe to see the final readings from Markit. Germany and the Euro-zone numbers are due, with the initial readings at 41.9 and 45.7 respectively, along with the construction PMI from the UK, which had a provisional estimate of 43.3. Note, all three readings are well below the 50 contraction/expansion threshold.
The US session features October New York business conditions (an improvement to 45.8 from 42.8 is expected). Factory orders for September are also on tap and are expected to decline 0.3% m/m, a steeper drop than the -0.1% posted in August.
