DOW
To set the stage, I must refer to prior analyses to explain today's seemingly radical interpretation.
June 1, 2014
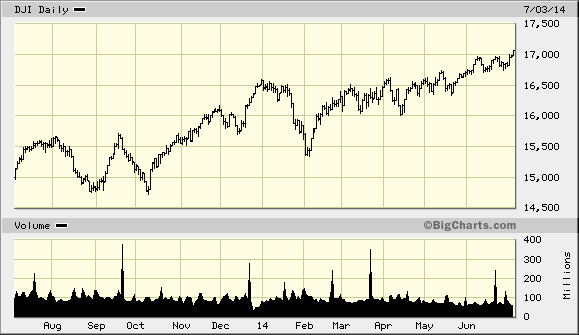
"As reported often in recent months' reports, the technical expression of increasing volatility and attendant growing risk of collapse is known as the "expanding triangle."
"More than once now, I have illustrated the seculartriangle that has formed over the past 14 years, while also drawing attention to intermediate (December - now)and short term(March - now) expanding triangles, to create a trinity of ever-decreasing-in-size expanding triangle formations."
"However, the excerpt from the May 18 report which appears in that paragraph above the chart warns of a 3rd triangle this year, the latter being a near-termformation.
"A move of only a few points higher from here on an intra-day basis (Monday?) would create the 4th triangle formation, and 3rd this year. Secular, intermediate, short term and, now, near term. Unbelievable."
Above, we see my past discussion of expanding triangles of different degrees of duration, from extremely long to very near term periods.
Additionally, the 2 paragraphs immediately below the following Dow 's 1-year chart discuss the repeated occurrence of internal momentum divergences, as well as macro divergences between the Dow and other international indices.

"The Dow is unconfirmed on multiple internal and external levels, with the coiled nature of the pattern suggestive of explosive action to come. That "coiling" is also evident in the precious metals, however they are going in the opposite direction in those cases.
"Coiling and expanding triangles each (let alone both) point to a manipulated stalling of the inevitable, as smart money finds different places to park its capital, whiledistributing shares throughout the entire topping formation."
However, when we consider the "stalling" and "coiling" discussed in the preceding paragraph, we may - and indeed MUST - acknowledge that the rules have been suspended by un-free market forces, causing the increasing volatility implied by expanding triangles to attend that day when they implode with shocking speed all at once, when there does not remain even a single dollar left that could go long equities.
Friends, as I look at the chart above, for the first time, I see the possibility of a parabolic conclusion. This jibes with manipulation that overwhelms otherwise typically terminal expanding triangles.
Perhaps it is the prejudice of these aging eyes to revisit my chart analyses of 1989, when I forecast the day of the Nikkei 225's peak (using an analogue to 1929).
Simply, double the numbers: Imagine that the 1989-Nikkei is at 34,000 en route to 39,000 for the first day (Saturday morning) of 1990.
To-date, I recommended a 2-year over 1-year deep out-of-the-money calendar put spread, or buying the long side (2-year put) before establishing the short side (1-year put) of the spread, after an initial smash that I felt could have taken the Dow to 14,500.
I advise taking a minor percentage loss on the latter position, while those who took the former stance need not do anything, since I believe that time will have vindicated that spread strategy.
My attention is now set square on crowd insanity.
We all know of the disconnect between the economy and the stock market but, PRECISELY DUE TO THE FACT THAT THIS IS SUCH AN ENORMOUS MEGA-CYCLE (~250 YEARS) THAT IS CONCLUDING, so extreme must be the illogic and irrationality of the situation, such that a parabolic conclusion may indeed be in order.
19,500 Makes sense because investors' desire to participate in and not miss the party at 20,000 would be the way of getting the last dollar into the market and, of course, smart long term stock distributors play their role in keeping the Dow short of that holy mark.
39,000 Was the Japanese public's heartbroken attempt at Nikkei 40,000. Is 19,500 the Dow's Waterloo?
NIKKEI
June 1, 2014
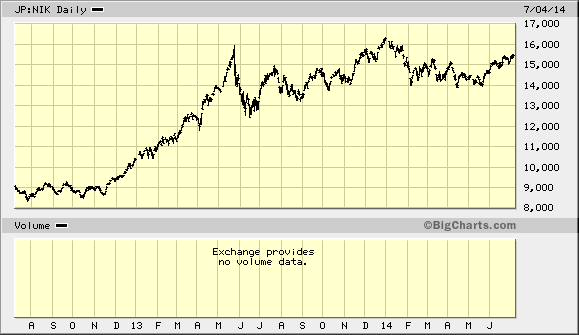
"The 3-year Nikkei charton the next page continues to plainly illustrate a lengthy distribution phase within a shoulder-head-shoulder formation, along with a major divergence against the Dow Jones." (Updated 2-year Nikkei chartconcludes section.)
The June report advised that existent short positions use a 15,200 close-only stop.
I didn't believe that the Nikkei would follow the Dow higher in achieving a new peak, but I also felt that a logically derived stop to protect profits would make sense in this gravity-defiant investment world.
Having said that, the fact remains that the Nikkei has not made new highs and the Dow would really need to remain buoyant to attract such an eventuality, given all of the overhead resistance that the US hedge fund managers' supply offers.
Therefore, there will be a quick interim report should an easy re-entry on the short side appear to present itself. Lower risk short entry points in this market remain logical.
Still, if the Dow is indeed heading to 19,500, this Japanese index could see 17,000, no?

SHANGHAI
May 4, 2014
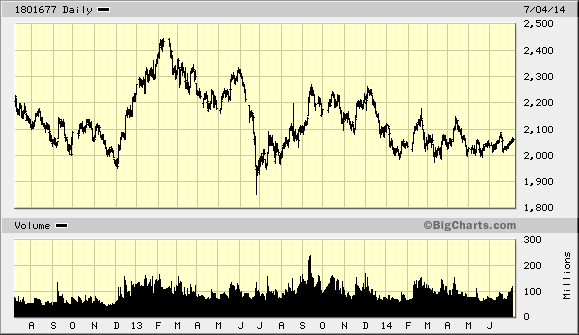
"The Shanghai Composite would have to break above 2150 to crack the downtrend which appears destined to collapse under 2000 en route toward 1600, and 1000 before 2017 is over."
Nothing has changed for the Shanghai Composite.
With 5 successive lower highs since September 2013, this index's rollover appears to indicate that Shanghai wishes to follow the world lower, rather than lead it there.
The multiple tests of 2000 suggests that the index will crack (no longer a possible triple-bottom, the rule favours a break), with an ominous-looking ascending wedge from this most recent bottom ingloriously adding to the unfortunate landscape in China.

