February ‘17 EOM,
Managed Managed Money (Registered CTA and CPO)
MARKET SYMBOL BIAS LONG/SHORT
ENERGY CL 91.16% Managed Longs
ENERGY HO 73.78% Managed Longs
ENERGY NG 87.96% Managed Longs
ENERGY RB 78.38% Managed Longs
METALS GC 68.83% Managed Longs
METALS SI 87.96% Managed Longs
METALS PL 89.16% Managed Longs
METALS PA 93.05% Managed Longs
METALS HG 77.44% Managed Longs
GRAINS ZC 61.07% Managed Longs
GRAINS ZS 88.80% Managed Longs
GRAINS ZL 70.27% Managed Longs
GRAINS ZM 83.54% Managed Longs
GRAINS ZW 58.23% Managed Shorts
MEATS LE 88.99% Managed Longs
MEATS HE 85.02% Managed Longs
SOFTS CT 90.46% Managed Longs
SOFTS CC 61.36% Managed Shorts
Reported by Brokers
MARKET SYMBOL BIAS LONG/SHORT
ENERGY CL 70.09% Retail Long
ENERGY HO 53.32% Retail Long
ENERGY NG 69.11% Retail Long
ENERGY RB 59.84% Retail Long
METALS GC 71.10% Retail Long
METALS SI 69.11% Retail Long
METALS PL 87.44% Retail Long
METALS PA 57.11% Retail Short
METALS HG 75.69% Retail Short
GRAINS ZC 62.90% Retail Long
GRAINS ZS 52.02% Retail Long
GRAINS ZL 73.49% Retail Long
GRAINS ZM 78.01% Retail Long
GRAINS ZW 62.79% Retail Long
MEATS LE 53.57% Retail Short
MEATS HE 70.35% Retail Short
SOFTS CT 79.98% Retail Long
SOFTS CC 62.89% Retail Long
Commitment of Traders Report for Commodity Futures as of Tuesday Feb 21st 2017 (Raw Data Source: CFTC).
It never fails to amaze me how often the retail speculating crowd holds positions opposite of the managed money traders. I think it has to do with the mental fallacy that price will quickly retrace the prior move and that they will be taken along for the ride, but that is just my speculation.
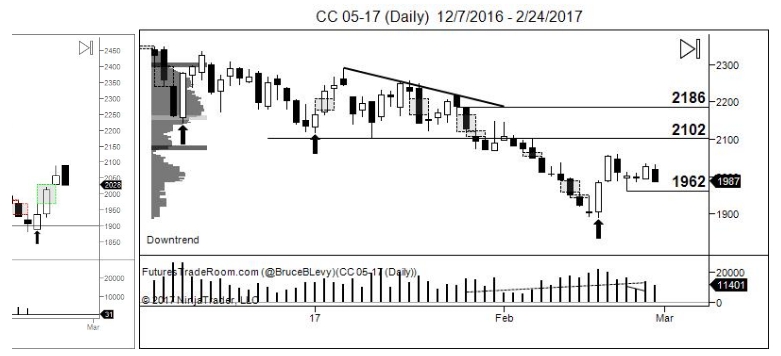
In the case of Cocoa it has sold off hard over the last few months yet retail speculators continue to buy the falling knife without fail. It is very well possible that Cocoa will be met with aggressive selling to take out the prior lows; my biggest fear being that I will be stuck in a sideways consolidation for weeks on end as price probes for stops and challenges the downtrend. If this were the case I would look for an escape at some inevitable point.
It is because of this I am very picky with my executions, I am waiting for confirmation on a closing basis to show that there is a likelihood of other managed money traders receiving a sell signal as well. I can’t tell you how many times I’ve been too early to the trade only to be stopped out before it gets underway; I have learned my lesson over the years and so have become more selective in my price action analysis.
This is not to say that the trade won’t work out, that is part of the game, anytime a trader commits capital to a trade they are exposing themselves to losses.
One of the first things I consider is the drawdown, I do this by studying price action patterns. When you study Daily bars you become familiar with the price action patterns. If you are willing to do anything to get ahead in trading I suggest pouring yourself a drink and going back as far as your data is capable; track each bars open, high, low and close for as many days as you can. Do this on many markets. Eventually you will become to notice patterns, each pattern is unique but the underlying is the same.
Like a math formula, the formula stays the same, the only parts changed are the variables. In this case the market will test certain areas and each bar's position will be unique in nature but will usually fit within the formula.
I have been able to identify such specific levels on the chart and will wait for price action to come to these levels. Once price touches these areas I can see how it is reacting and that gives me clues.
Typically the reactions are good for a few days to a few weeks depending on if there is a larger underlying pattern formation taking place.
I have found it difficult to teach others exactly what I am seeing on a chart, I have gone as far as developing indicators to track these patterns and levels of interest to help me quickly identify these patterns at a glance.
Reading the newsletter and tracking it carefully is probably the best solution for anyone interested in seeing if this works.
To aid in the tracking of the levels and technical levels I have begun posting last issues chart along with the current for comparison.
Cocoa CC 05-17 (Daily)
I am very eager to reinstate my short Cocoa position. Unfortunately it has not been able to close below 1962. If price were to close below 1962 I would like to see a probe of stops above the prior days high, or I would ride the momentum down if it were able to continue.
Regardless, the scenario has not taken place yet and so I am unable to do anything. At the current location we are within an immediate 6 day trading range that could very well build into support over the coming week. While I don’t expect an immediate breakout, I can expect price to test the prior 6 day trading range as well as reach for stops above and below the range. Selling now holds no significance other than the likelihood of being involved in consolidation and being forced to liquidate at the worst moment; this is the uncertainty of directional trading.
Let's assume we take the past 6 days and put them into a bar, what would it look like?
6-Day Bar of Cocoa
This is an actual screenshot of the past 6 days of consolidation put into a bar. As you can see it represents indecision on a larger time frame. This tells me the trade is not ready, and if I miss it then at least I will have learned something because I am tracking it on a daily basis, that experiential experience of following the development will become ingrained in you deeper than if you were to pull up a chart with pre-existing data. The act of watching price develop in real time cannot be substituted except by perhaps machine learning or fractal algorithms.
I also wish to theorize on another scenario for Sunday’s open whereby Cocoa fails to hold the Friday lows being that it closed on its lows. Whenever a bar closes on its lows, especially on a Friday it is often very likely to extend lower on the next open; this is not a quantified occurrence with statistical significance but yet rather an observation. This could make room for an intraday momentum trade.
I will sit on hands for now and see what scenario develops. 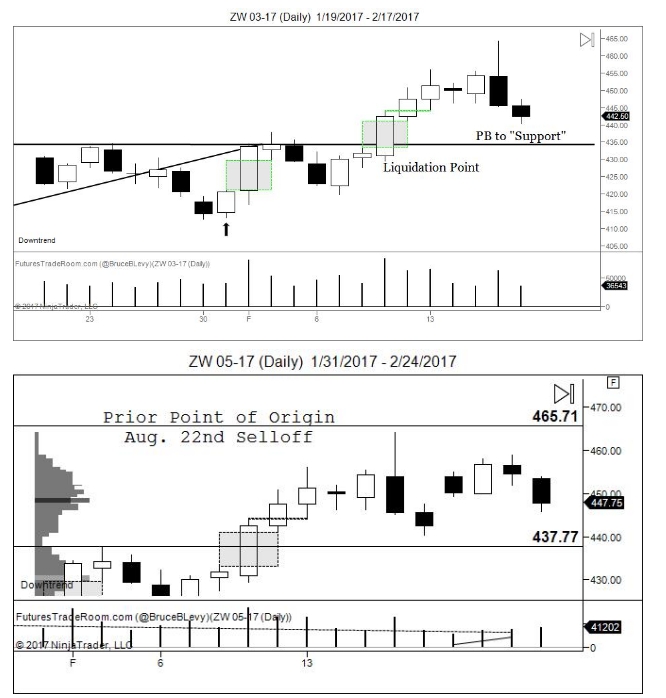
Wheat ZW 05-17 (Daily)
Last weeks Pullback to support held the 437.77 level but it appears to lack the additional buying to breakout above the prior August selloff point of origin. The Point of Origin is simply a level that initiates the beginning of a sudden distribution to a new trading range. The current breakout range is between 437 and 465. I will consider taking a position a close outside these price levels found on the volume profile.
Crude Oil CL 04-17 (Daily)
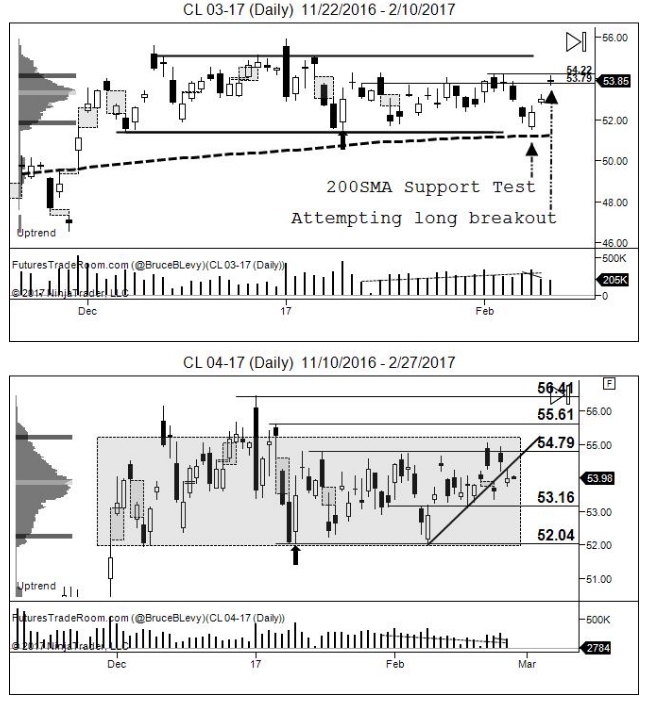
I have chosen to highlight the main profile range as well as some price levels of interest. I believe Oil is being primed for a dramatic distribution. I am concerned for the gap up patterns where it is met with immediate resistance and almost always closes lower that day. The only reference to this I can make is through Stan Weinstein's work on stage analysis, it appears to be a stage 3 where after a run up it trades sideways with wide and whippy price action.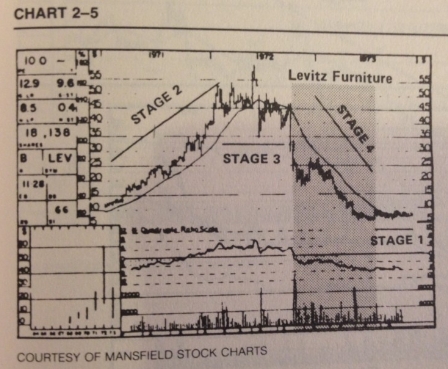
Stan Weinstein is a well respected analyst in the stock world and his institutional newsletters go for upwards of $50k per subscription. I have had the pleasure of learning first hand from his material and understand that such market moves may take a while to complete.
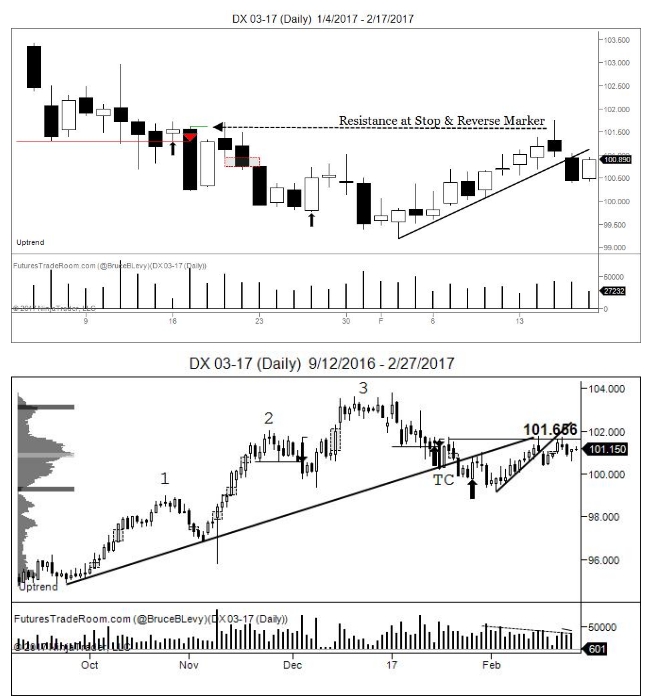
US Dollar Index DX 03-17 (Daily)
Dollar is still currently under the 101.65 stop and reverse marker. After putting in 3 peaks it developed below the bull trendline and is currently coming back up to the point of origin. If we can get a close above the S&R marker I will consider a long position in the Dollar. If on the other hand it lags and volume dries up in this area I will consider a short position. Notice how all the markets we have reviewed are in this sideways holding pattern. Lets not get too ahead of ourselves and be eager to get into a directional position until we have some confirmation.
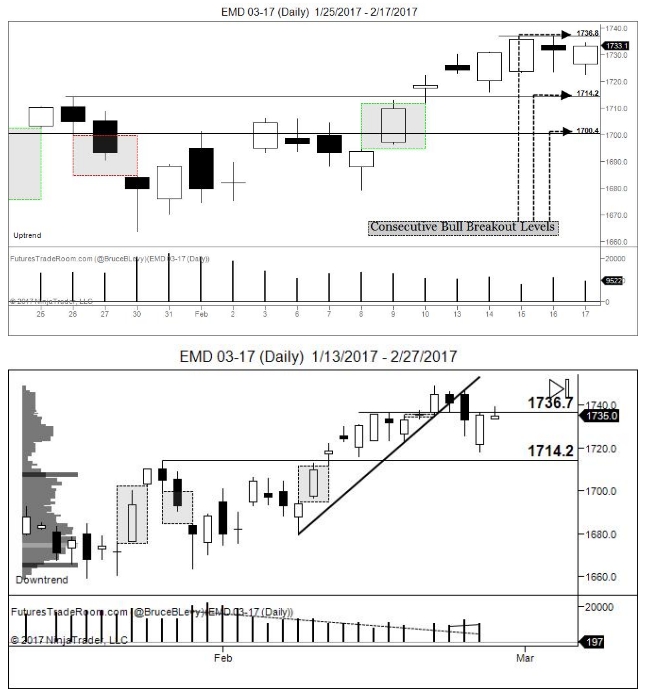
E-mini S&P Midcap 400 EMD 03-17 (Daily)
In the last report 1736.7 was the breakout zone, we saw a weak close above that level later in the week on very low volume followed by a selloff into the prior trading range. I would like to see a support test of the 1714 level prior to taking anymore long break outs. 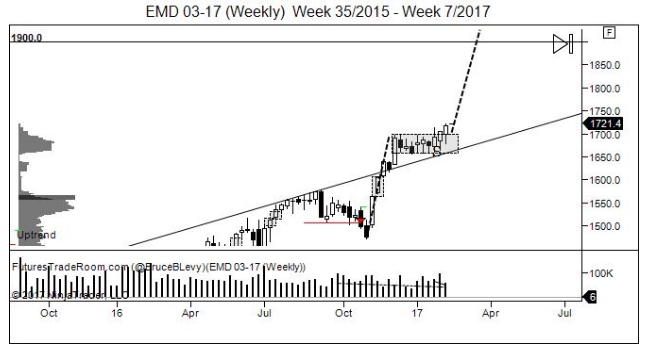
This chart taken about 3 weeks ago, I will continue to post this chart so we can monitor the development of the Weekly measured move to 1900s.
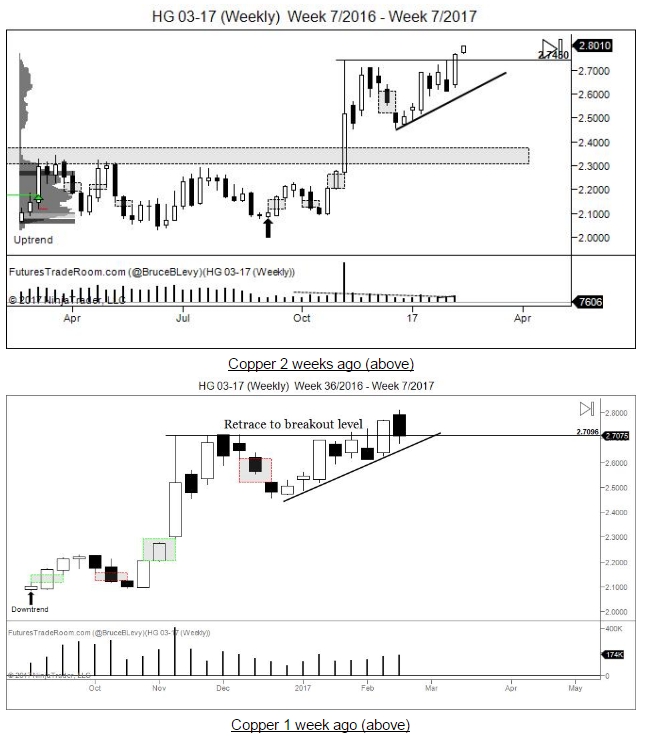
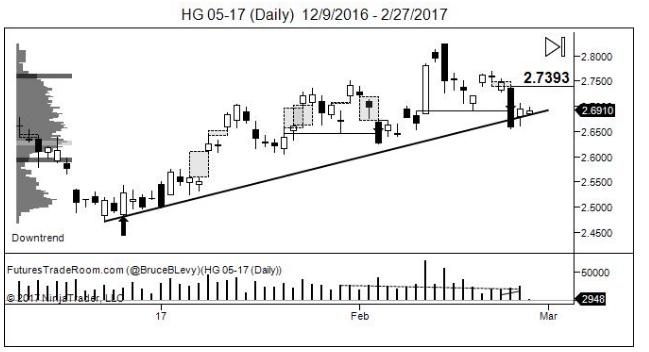
Copper HG 05-17 (Daily)
Copper is beginning to chop around a bit similar to oil. As more noise comes into the market the wider the price levels of interest become. These price levels are essentially important levels that trigger potential signals if it is able to close above/below.
The S&R marker at 2.73 will be on my radar going forward. A close above, or a failed attempt to probe this level will give clues going forward.
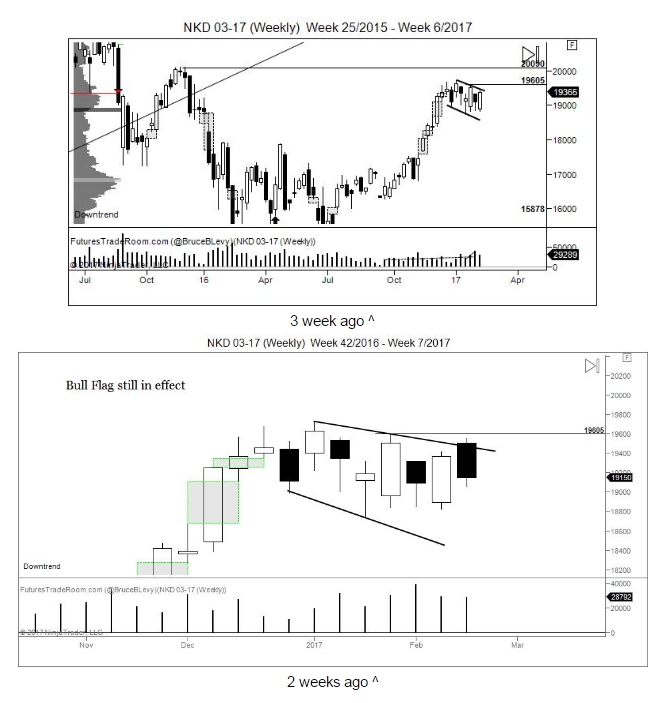
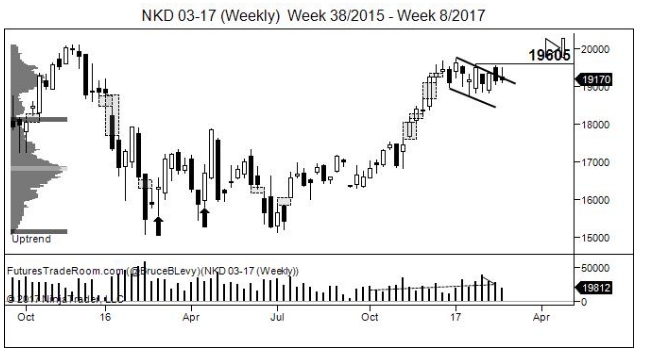
Nikkei 225 NKD 03-17 (Weekly)
Last week’s analysis of the bull flag formation with a long breakout signal at 19605 is still in play however as you can see it has gone really nowhere. I will keep NKD on the radar during this consolidation period in hopes of a long breakout at some point.
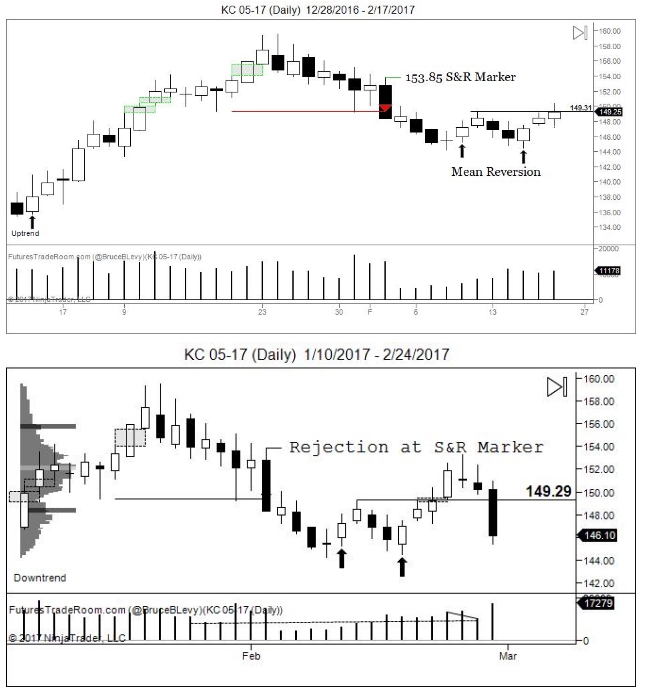
Coffee KC 05-17 (Daily)
“Coffee is setting up nicely for a long breakout. We have seen two mean reversion setups occurring within days of each other, in addition a breakout of the 149.31 level should put coffee above the 153.85 stop and reverse marker.” -Quote from last week’s report.
So as we can see Coffee gave a slight breakout but closed with weakness the next day, never a good sign. We can see that it found a lack of participation at the Stop and Reverse marker and the minor rally sold off rather than holding breakout support. Since it could not hold breakout support our bias on Coffee is now to the downside to take out mean reversion lows which if violated would generate a sell signal.
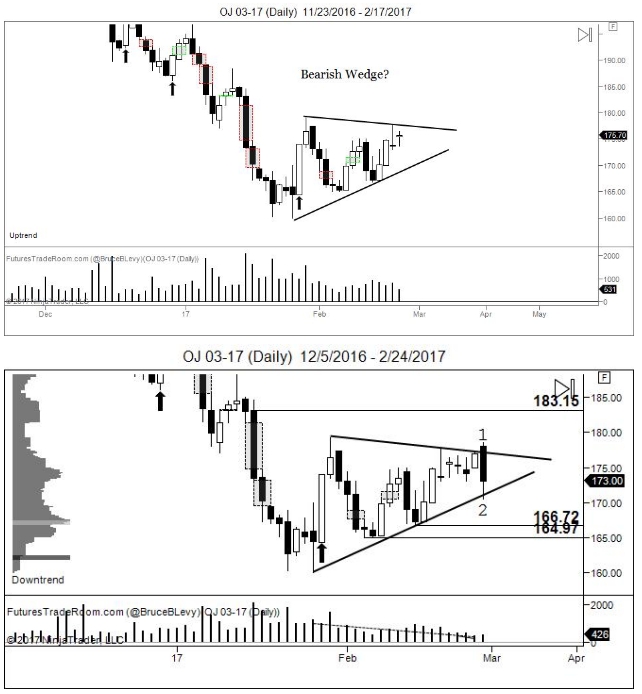
Orange Juice OJ 03-17 (Daily)
Orange Juice has tried to breakout of out our bear pattern with no success. 1 shows it opening above the trendline high but quickly selling off to test the lower trendline. 2 shows the selloff being absorbed with slight accumulation.
A wide range bar like this could easily trigger a breakout at the highs or lows in either direction. I have labels a few levels of interest based on the profile.
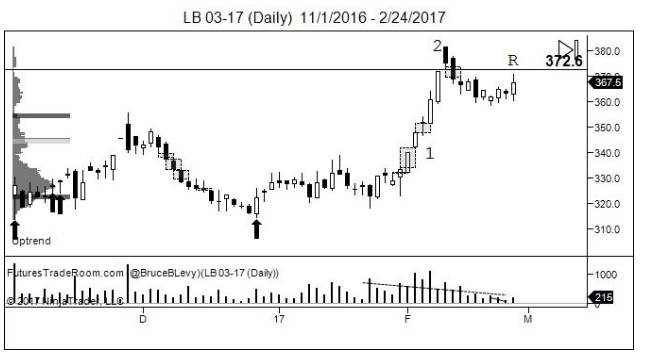
Lumber 03-17 (Daily)
Lumber now retesting prior high 372.60 breakout level from May.
1 showing the initial acceleration/capitulation and 2 showing the blowoff/failure.
Price has balanced and is now holding the 360s level. In the next chart the Weekly looks interesting, a decisive close above 375 with volume would trigger a long entry. Keep in mind that any early entries have downside risk to nearly 300 based on the weekly pattern.
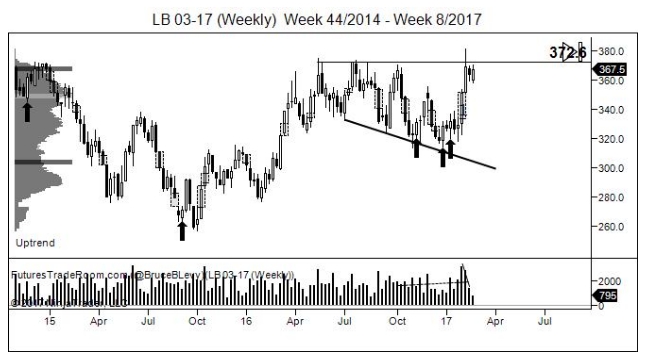
Lumber (Weekly)
FuturesTradeRoom is a publisher of trading software products.
Formula72.com manages client accounts
Please see attached risk disclaimers.
