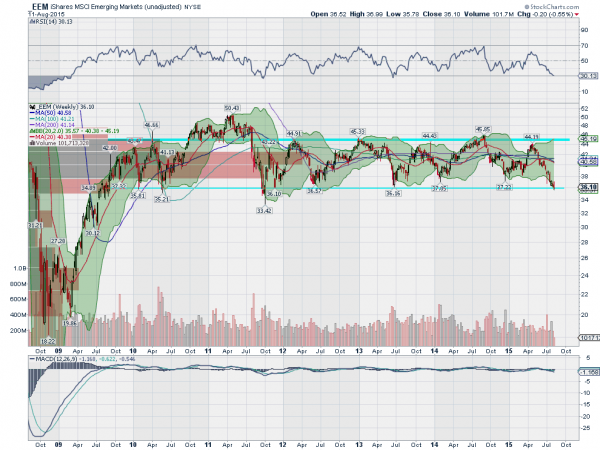
The focus over the past 24-hours has been on China. As they tweaked the yuan, a ripple went through the global markets. Or maybe it was from something else. Before that we had the crisis in Greece that was threatening all of Europe. And throughout all that, a debate in the US about when the Fed will raise interest rates.
What do all these things have in common? None of them have had any material impact on the world equity markets. European markets are sitting at all time highs, similar to those in the US. The Japanese Nikkei is approaching 15-year highs. You can argue about China with the Shanghai Composite 20% off its high, but that is still almost 100% above where it was this time last year! Every market is doing great. Well, there is one that is not: emerging markets. Emerging markets are sinking like they are correlated to climate change.

The chart above shows the iShares MSCI Emerging Markets ETF (ARCA:EEM) on a weekly basis since mid-2009. Look at the last 4-years. Nothing, absolutely nothing, has happened. In fact, after a monster fall like all equity markets into the 2009 low, it overshot the range to the upside and then briefly to the downside before settling in. This is really a 6-year range!
So emerging markets have done nothing while world markets are blasting higher. Some will tell you that this is expected. With strength in developed economies it is time to invest there. The emerging markets will lag and join after the developed markets have reached strong valuations. Okay, maybe, but they are not just lagging right now. They are on the verge of a breakdown.
The ETF has been at the bottom of this range before so maybe it will bounce again. The important price levels to watch are 36 and then 34. It has stopped every time at 36 except once since 2010, and it is there right now. The one time it didn’t, on that initial undershoot, 34 was important. If the price gets under 34, you can see from the horizontal read volume by price bars on the left side that there is a vacuum of price history underneath. This means it could fall far and fast.
Disclaimer: The information in this blog post represents my own opinions and does not contain a recommendation for any particular security or investment. I or my affiliates may hold positions or other interests in securities mentioned in the Blog, please see my Disclaimer page for my full disclaimer.
