Emerging Market Equities
Recntly, we provided an overview of where things stand in Emerging Markets, here. EM has struggled in 2021 after a hot start. Weakness out of China and Taiwan has pressured the MSCI Emerging Markets index, and you can pin the underperformance to the shift away from big cap tech and growth.
Tech Weighs on EM Since Mid-February
Recent losses in the NASDAQ, particularly the FANGMAN stocks, bled into companies like Taiwan Semi (NYSE:TSM), Tencent (OTC:TCEHY), and Alibaba (NYSE:BABA). iShares MSCI Emerging Markets ETF (NYSE:EEM) is the tradable asset that corresponds to the MSCI EM Index.
EEM’s three largest holdings are off 20% from their mid-February peaks. What’s more, EEM’s 80% weight to Asia (and 37.5% weight in China alone) is largely a play on how things progress on that continent. Today’s emerging market index is not like that of the past—Tech, Discretionary, and Communication Services together are more than half of the index. It is quite a shift from EM’s mid-2000s heyday during which the index was oriented to cyclical sectors like energy and materials.
Developed Markets Show Signs of Life On a Relative Basis
International investors undoubtedly notice what is happening away from emerging markets. Developed markets are not far from their all-time high despite some shakiness in US stocks. iShares Core MSCI International Developed Market (NYSE:IDEV) tracks the cap-weighted developed market index.
It is the tradeable ETF that corresponds to the MSCI Developed Market Index (ex-USA). IDEV is much different from EEM when analyzing the sector breakdown. Financials are 18% of the ETF followed by 16% in Industrials. Information Technology is a relatively meager 8.6%. As for the country breakdown, IDEV has a 21% weight in Japan and 14% in the UK. Europe is 55.5% of the ETF.
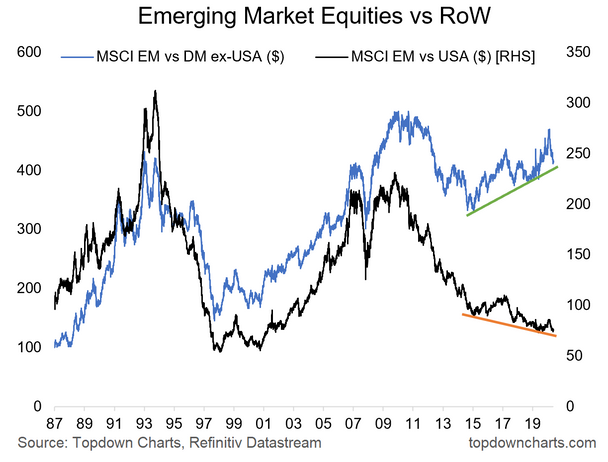
Featured Chart: EM vs. RoW
That brings us to our featured chart comparing Emerging Market stocks versus the Rest of World index. We break out the performance by EM vs. DM (ex-USA), and EM vs. USA (via Invesco S&P 500® Equal Weight Consumer Staples ETF (NYSE:RHS)).
This zoom goes back to 1987 for a long-term perspective. Despite weakness in the last three months, EM vs. DM ex-USA has been trending higher since 2015. The relative strength line is nearing support, so further declines could be a buying opportunity for emerging markets. Meanwhile, EM vs. USA has been trending down since 2015 after severe underperformance following the GFC. EM is yet to fully shake off the long-term downtrend vs. US stocks.

Our View
Overall, we see relative value and strong macro/cyclical indicators in emerging markets. Technicals are mixed and sentiment runs high. What could pressure EM stocks is the threat of further tightening of monetary policy due to inflationary risks.
We favor EM ex-Asia over the broad MSCI EM index as: technicals improve, intermarket signals turn more bullish, valuations are cheaper, and investor positioning is still low.
More ETF flows could come into EM ex-Asia in the coming months as the market takes notice. EM ex-Asia is a much better play on the value theme considering the index has a 33% position in Energy plus Materials and 31% weight in Financials. Discretionary, Communication Services, and Tech comprise just 18.7% of the index (with Tech at just 0.7%).
Which stock should you buy in your very next trade?
With valuations skyrocketing in 2024, many investors are uneasy putting more money into stocks. Unsure where to invest next? Get access to our proven portfolios and discover high-potential opportunities.
In 2024 alone, ProPicks AI identified 2 stocks that surged over 150%, 4 additional stocks that leaped over 30%, and 3 more that climbed over 25%. That's an impressive track record.
With portfolios tailored for Dow stocks, S&P stocks, Tech stocks, and Mid Cap stocks, you can explore various wealth-building strategies.
