It has been about two weeks and market sentiment seems to have quickly turned decidedly bearish and the S&P 500 Index is down only 2.2% from its high. I will not list all the bearish commentary over the last few days, but we even pushed out some thoughts this weekend that leaned a little bearish.
A couple of reasons for the increased bearishness might be the fact the market has gone over a year without a pullback of more than 5% and stock valuations do appear elevated on an absolute basis.
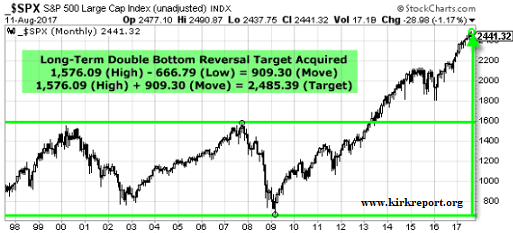
Lastly, with the increase in technical and computerized trading, readers should know the S&P 500 Index acquired a significant target price that was triggered over four years ago and was formed out of a 16 year trading range for the market. Once significant levels like this are reached, it is not uncommon for the market to at least consolidate gains. 
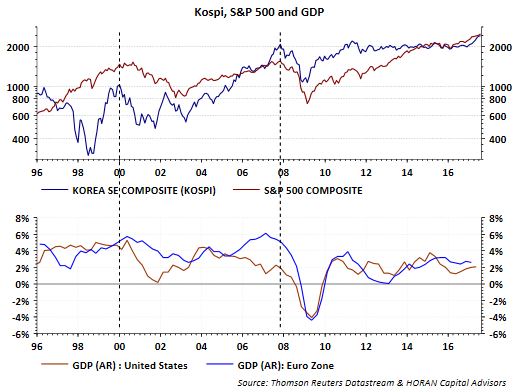
So enough of the bearishness, what might the market be projecting now. One index that has a fairly good track record of providing a clue to other market moves is the KOSPI Index, or the Korea Stock Exchange Index. This index is frequently referred to as Dr. KOSPI, partially due to the fact it leads or takes care of the other indices. Noted economist, Ed Hyman of Evercore ISI, believes the KOSPI index is a leading indicator of the global economy as South Korea's exports account for over 40% of the country's gross domestic product. In other words, the KOSPI Index performance is a reflection of the health of the global economy. Over time, the KOSPI Index returns tend to lead the performance of the S&P 500 Index. Some of the history is displayed in the below chart. 
What can be seen in the first section of the above chart is the KOSPI Index (blue line) begins to trend down in advance of the S&P prior to the tech bubble and real estate crisis. The KOSPI also turned lower in advance of the debt ceiling crisis in the U.S. in August of 2011 and the U.S. credit downgrade.
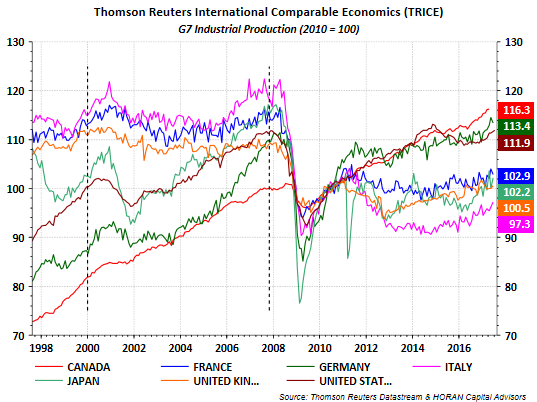
The next chart shows G7 Industrial production around periods in which the KOPSI turned lower in advance of U.S market turning points. The dotted lines are at the same time period as in the above chart. The contraction in industrial production tended to occur within about six months following declines in the KOSPI Index. 
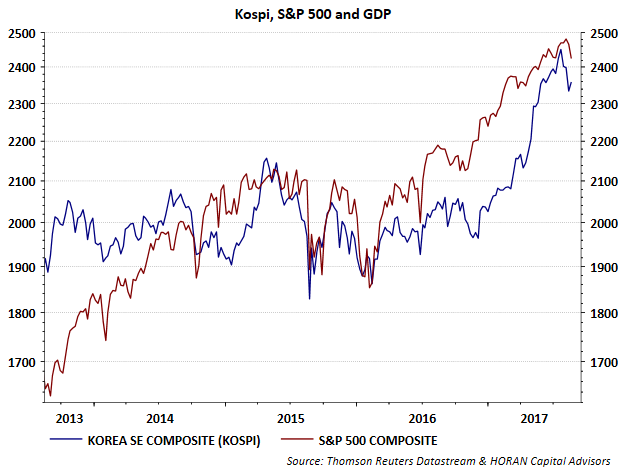
So where does that leave the market potentially positioned today. The below chart represents a shorter time frame of the earlier KOSPI/S&P chart. What is clear from the chart is the KOSPI began to weaken in July, in large part on concerns with North Korea in my view. The last week or so has seen a rebound in the KOSPI at a time the S&P 500 Index continues its move lower though. 
I would surmise Dr. Kospi's market diagnosis at the moment is one of cautious optimism. We are in a seasonally week period as it relates to the calendar, i.e., summer, the market has not had a pullback of 5% or more in more than a year, valuations are above their long term average and last week's industrial production report was positive but below expectations. On the other hand, market commentary has turned more bearish in a short period of time. From a contrarian standpoint, the market does not tend to reward investors who are correctly positioned for a correction. If recent bearishness is a sign of actual investor positioning, a market that moves higher is likely after a bit more summer weakness, i.e., a market that climbs the proverbial wall of worry.
