⭐ Start off 2025 with a powerful boost to your portfolio: January’s freshest AI-picked stocksUnlock stocks

Dow, NASDAQ Haven't Done This Since The 2009 Bottom

Published 02/05/2019, 12:45 AM
DJI
-
IXIC
-

After a rough fourth quarter of 2018, the stock market has been in rebound mode in 2019. In fact, the Dow Jones Industrial Average (DJI) and NASDAQ Composite (IXIC) just notched their sixth straight weekly wins -- a feat not accomplished for either index since late 2017. What's more, the strength the Dow and NASDAQ have shown during this most recent win streak is something Wall Street hasn't seen since right around the March 2009 bottom.

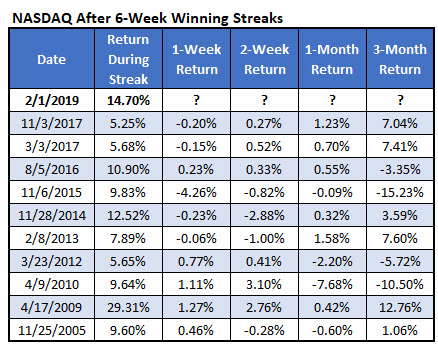
Specifically, the DJI gained 11.67% during this year's six-week rally -- the biggest gain during such a streak since it surged 22.7% in the six weeks ended April 17, 2009. Likewise, the NASDAQ shot 14.7% higher during the latest weekly win streak -- the biggest since that same stretch after the March 2009 bottom, when it rallied 29.31%, per data from Schaeffer's Senior Quantitative Analyst Rocky White.
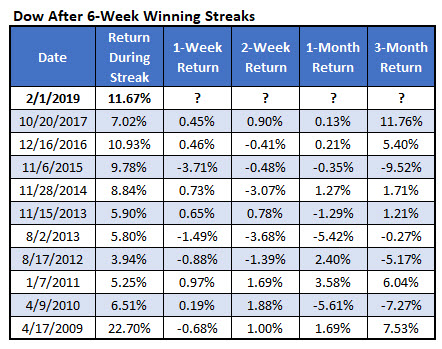
Dow After 6-Week Win Streaks

Nasdaq After 6-Week Win Streaks

Historically, six-week winning streaks have preceded even more strength for both indexes. The Dow has enjoyed 82 of these streaks since 1900, after which the blue-chip barometer extended its run to a seventh week 57.3% of the time, averaging another one-week gain of 0.32%. That's compared to an average anytime one-week gain of 0.13%, with a win rate of 56.7%.

In fact, the DJI tends to outperform at all checkpoints, looking three months out. A month after six-week win streaks, the index was up 1.2%, on average -- more than twice its average anytime return -- with a stronger-than-usual win rate of 69.5%. Three months later, the DJI was up 2.89%, on average, and higher 68.3% of the time -- much better than usual.
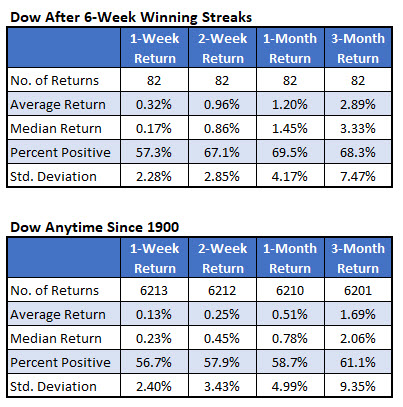
Dow After Streaks Vs Anytime

It's a similar story for the NASDAQ. There have been 48 six-week win streaks since 1971, and the IXIC went on to enjoy a seventh straight weekly gain 68.8% of the time, averaging a one-week return of 0.54%. That's compared to an average anytime one-week gain of just 0.21%, with a positive rate of 56.8%.

Two weeks out, the NASDAQ was up 1.51%, on average -- more than three times its average anytime two-week return of just 0.42% -- and was higher a whopping 75% of the time. Three months later, the IXIC averaged a stronger-than-usual gain of 3.3%, and was higher two-thirds of the time.
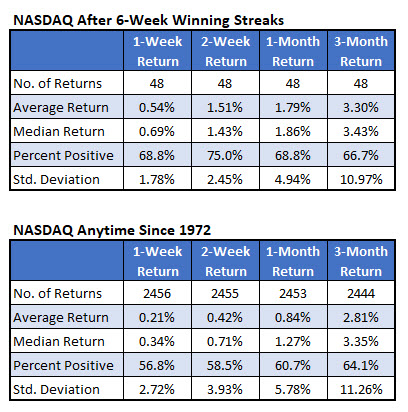
Nasdaq After Streaks Vs Anytime

Original post

Latest comments

Loading next article…
Risk Disclosure: Trading in financial instruments and/or cryptocurrencies involves high risks including the risk of losing some, or all, of your investment amount, and may not be suitable for all investors. Prices of cryptocurrencies are extremely volatile and may be affected by external factors such as financial, regulatory or political events. Trading on margin increases the financial risks.
Before deciding to trade in financial instrument or cryptocurrencies you should be fully informed of the risks and costs associated with trading the financial markets, carefully consider your investment objectives, level of experience, and risk appetite, and seek professional advice where needed.
Fusion Media would like to remind you that the data contained in this website is not necessarily real-time nor accurate. The data and prices on the website are not necessarily provided by any market or exchange, but may be provided by market makers, and so prices may not be accurate and may differ from the actual price at any given market, meaning prices are indicative and not appropriate for trading purposes. Fusion Media and any provider of the data contained in this website will not accept liability for any loss or damage as a result of your trading, or your reliance on the information contained within this website.
It is prohibited to use, store, reproduce, display, modify, transmit or distribute the data contained in this website without the explicit prior written permission of Fusion Media and/or the data provider. All intellectual property rights are reserved by the providers and/or the exchange providing the data contained in this website.
Fusion Media may be compensated by the advertisers that appear on the website, based on your interaction with the advertisements or advertisers.
© 2007-2025 - Fusion Media Limited. All Rights Reserved.