The coronavirus pandemic is wreaking havoc on the global economy. Governments are closing malls, restaurants and literally all kinds of social gathering places, and even putting entire cities on lockdown. In the meantime, stock market indices are in free fall. The S&P 500 is down 28.7% YTD and the Dow Jones Industrials lost 35.2% since mid-February.
In this respect, the fact that the Dow Jones Transportation Average plunged as well is not surprising. What is interesting, though, is that this less followed index sent a warning as early as the summer of 2019. The world was yet to hear about COVID-19 and the economy was running at full throttle.
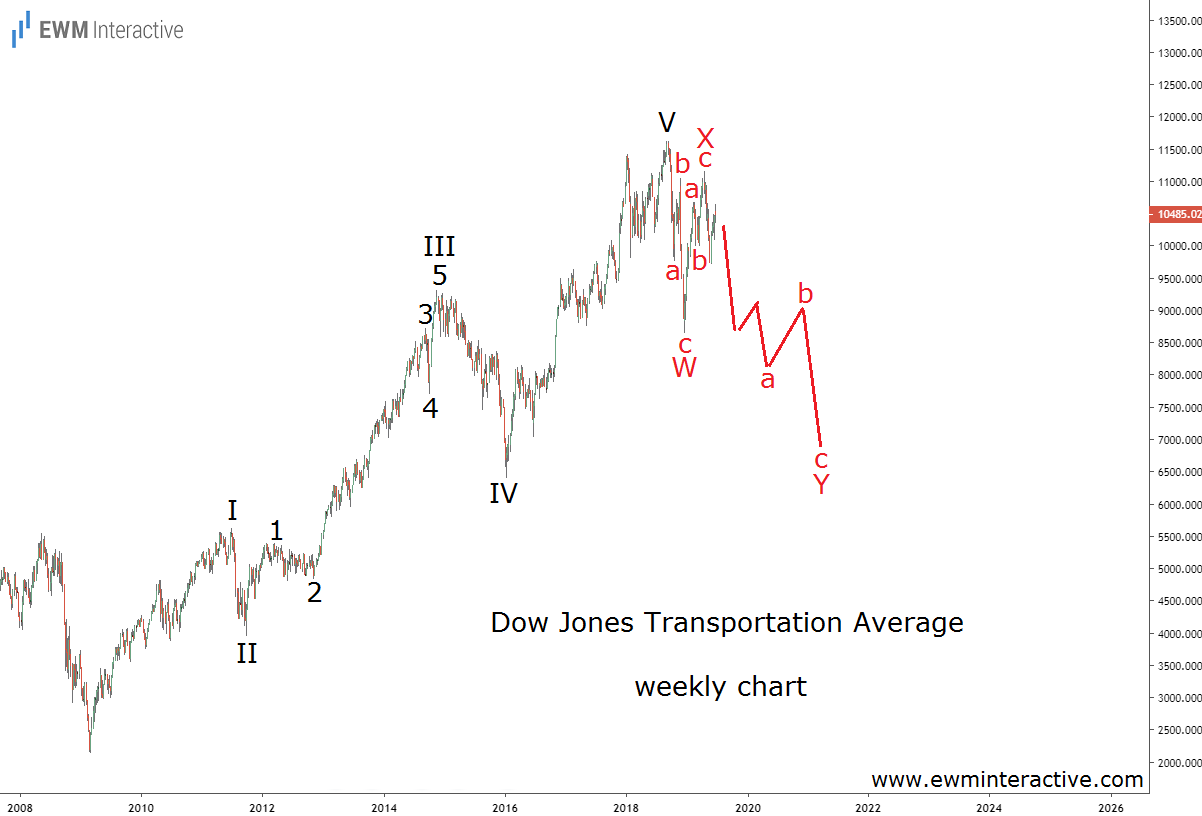
However, instead of letting complacency settle in, we were looking for early signs that the decade-old bull market was ending. On July 8th, 2019, we found one such sign on the weekly chart of the Dow Jones Transports shown below.

The chart revealed that the uptrend since the bottom of the Financial crisis in March 2009 formed a complete five-wave impulse. Labeled I-II-III-IV-V, this pattern meant a three-wave correction should follow. The drop to 8637 in December 2018 was too shallow to be all of it.
Instead, we thought a larger corrective pattern was in progress.
Corrections usually erase the entire fifth wave. A W-X-Y double zigzag made sense. “Wave Y down towards ~7000, possibly accompanied by a recession” was “the missing piece of the puzzle.“
Dow Jones Transports to Start Recovering amid Coronavirus Recession
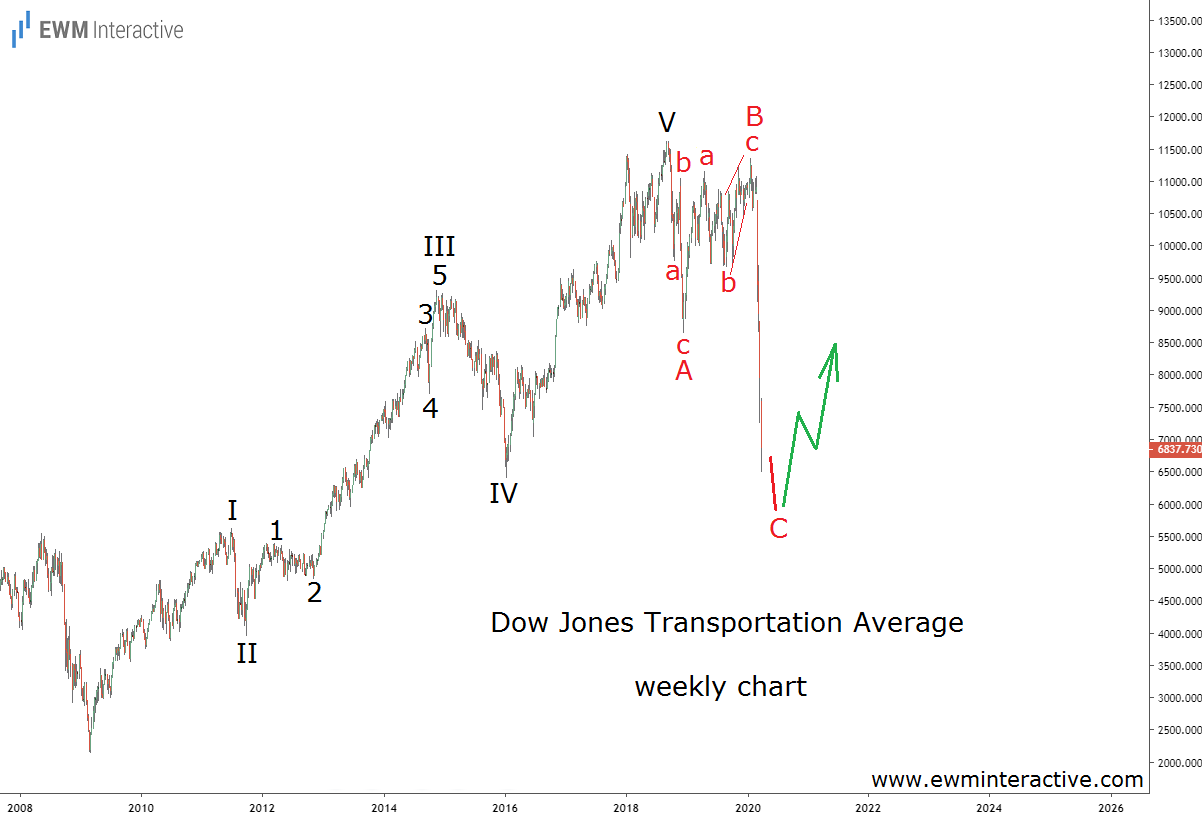
Eight months later now, a recession is practically guaranteed. Economists at Goldman Sachs (NYSE:GS) predict a brutal 24% GDP contraction in Q2. The Dow Jones Transports, in the meantime, fell below 6500 at one point last week. Take a look:

The selloff was much faster than expected. The correction looks more like a regular A-B-C flat correction now, but that doesn’t change much. It took wave C just three months to erase all of wave V’s gains. Nevertheless, amid all the doom and gloom, there is a silver lining.
Wave C just reached the support area of wave IV. The 5-3 Elliott Wave cycle seems complete. The theory suggests we should now expect the trend to resume in the direction of the impulse pattern. In other words, even if the bears manage to breach 6000, a bullish reversal should soon follow.
The coronavirus pandemic and the economic recession it is causing are far from over, but think about this: World War II lasted from 1939 to 1945. Yet, the stock market bottomed in 1942 and rose steadily during the last three years of the war. Also, the world was in a recession during the entire 2009, but the stock market started rising as early as March. The worst of a crisis rarely coincides with the worst in the markets. As Ralph Elliott once said, the habit of the market is to anticipate, not to follow.
