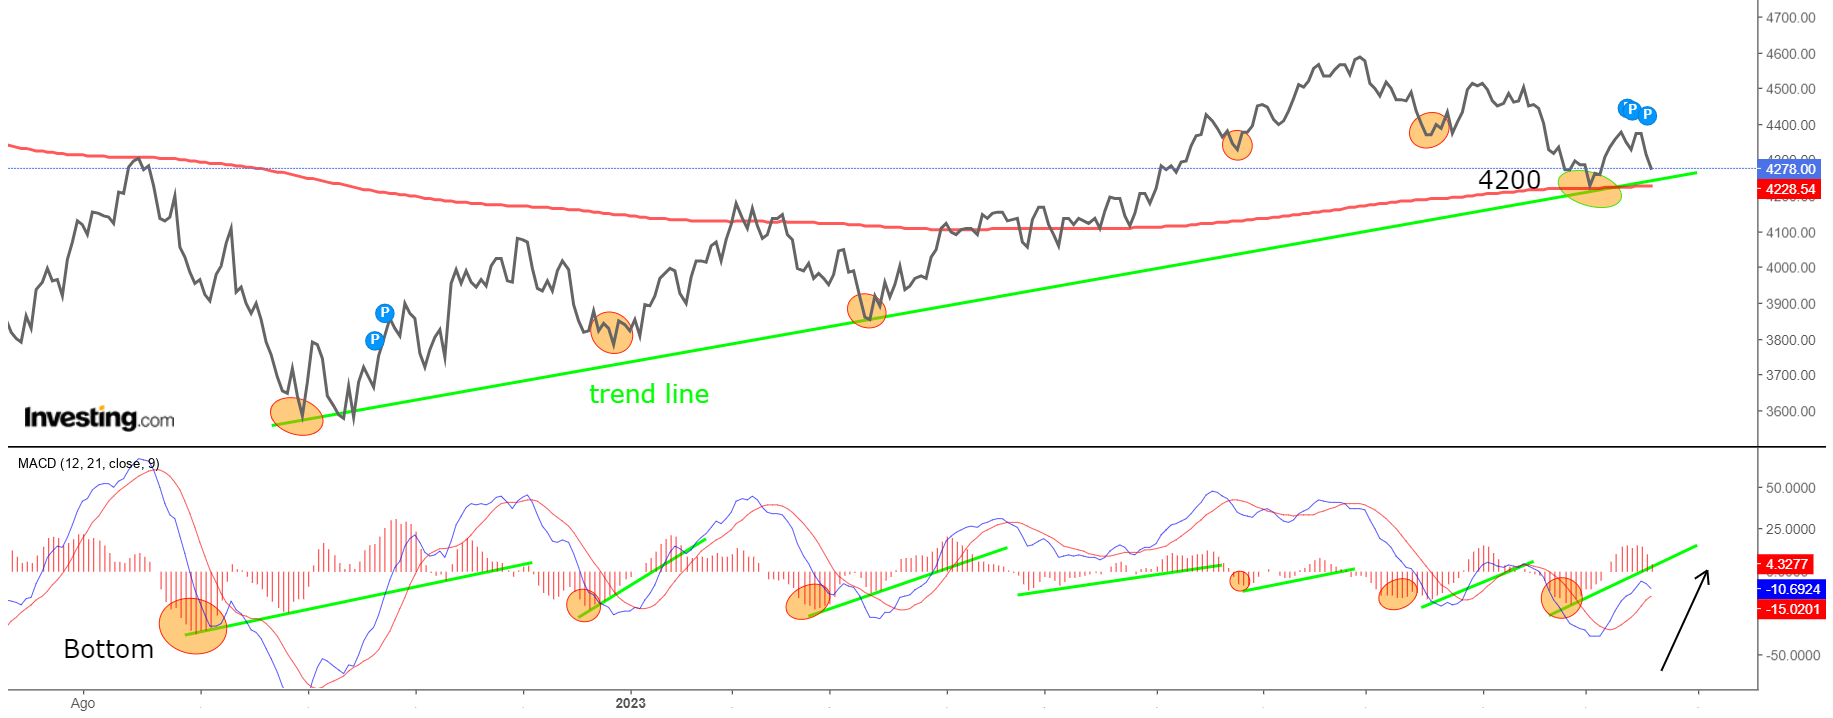
- S&P 500's support at 4200 held firm indicating that the bull market remains intact
- This is supported by the fact that the MACD indicator has registered a bounce off the trend line created from Oct. 2022 low, triggering a buy signal
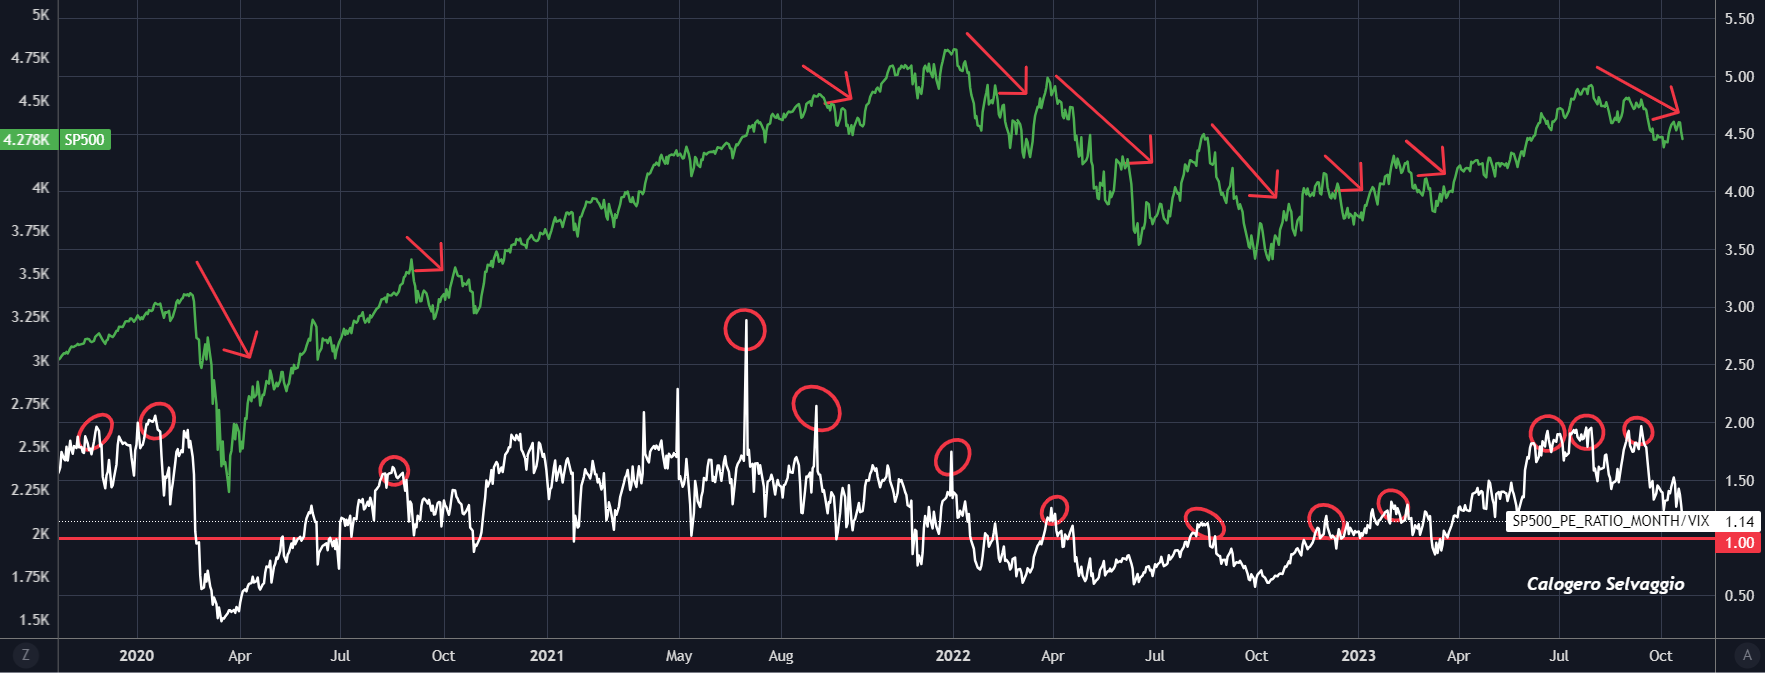
- Meanwhile, other indicators, like the S&P 500 P/E vs. VIX and BPI confirm the same
The past week marked the anniversary of the ongoing bull market. Over the last 12 months, the S&P 500 index has surged by more than 15%, while the Nasdaq has recorded a remarkable 23.5% increase.
During this period, the technology sector (XLK) has outperfomed with a 38% gain, followed by a 35% rise in the communications sector (XLC) and a 15% increase in industrials (XLI), making them the top-performing sectors.
In contrast, utilities (XLU) have declined by -6%, real estate (XLRE) by -4.5%, and consumer staples (XLP) by -0.45%, marking them as the worst performers.
This breakdown underscores the leaders and laggards in the current market cycle. The underperforming stocks are those that have struggled to keep up and may not be the best bets for the upcoming uptrend. In fact, the disappointed investors right now are most likely those who got stuck in the wrong stocks and sectors.
If we take the S&P 500 as a reference, we can see how the market has rebounded after anchoring at the support level of 4200 points, a key level dating back to an uptrend starting from the October 2022 lows and the 200-day moving average.
This level is significant as it coincides with the origin of a bullish trend starting from the October 2022 lows and the 200-day moving average based on the trendline drawn. Focusing on the Moving Average (MACD) indicator, which combines momentum and trend, it has registered a bounce off the trend line created from the lowest level since October 2022, triggering a buy signal.
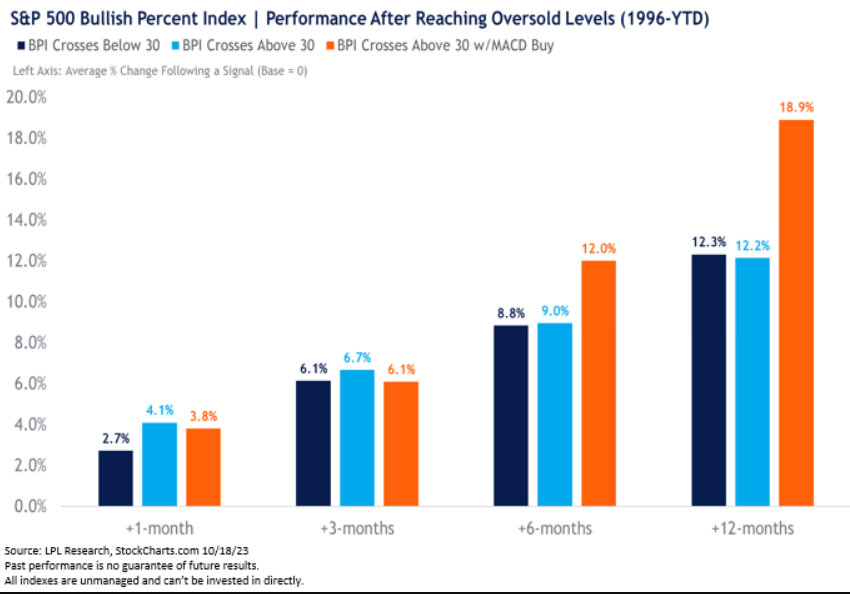
This is currently confirmed by the BPI indicator (the bullish percentage index of stocks in the basket), which touched the oversold level at the beginning of October and fell below 30%, precisely to 28%, marking the lowest level since 1996.  Source: LPL Research
These conditions, below the 30% threshold, indicated extreme oversold conditions but at the same time, the projection of the indicator above 30% along with the positive MACD indicates improving market breadth with a bullish trend.
Statistically, given the conditions previously outlined, the U.S. index (S&P 500) has delivered returns of 8.8% in six months, with the potential for even more robust performance exceeding 15% in the span of 12 months.
The pursuit of the belief that "this time is different" is a common tendency. However, history has repeatedly shown that such a belief often leads to underperformance for investors.
S&P 500 P/E Vs. VIX Chart Indicates Positive Upswing
An interesting observation concerns the relationship between the S&P 500's price-to-earnings (P/E) ratio and the volatility index. It is noticeable that when this ratio is high, it often aligns with significant market corrections or the onset of bear markets.
To be specific, a ratio exceeding 1 over the last three years has consistently preceded major downturns, acting as a prescient signal. At present, following a sharp increase, the ratio is approaching the minimum stress threshold.
Analyzing historical instances, one might contemplate that these levels could pave the way for a positive upswing.
Conclusion
Naturally, it's essential to acknowledge that the ongoing recovery carries inherent risks, given factors such as monetary policy uncertainties, escalating geopolitical tensions in the Middle East, and the recent upsurge in both the dollar and yields.
With numerous variables influencing the stock market's momentum, remaining vigilant is prudent. Historical trends have shown that the "unintended" consequences of monetary policies tend to materialize over the long term.
***
Disclaimer: This article is written for informational purposes only; it does not constitute a solicitation, offer, advice, or recommendation to invest as such it is not intended to incentivize the purchase of assets in any way. I would like to remind you that any type of asset, is evaluated from multiple points of view and is highly risky and therefore, any investment decision and the associated risk remains with the investor.

