Trading recommendations
Buy Stop 20740.0. Stop-Loss 20590.0. Take-Profit 20820.0, 20885.0, 21065.0, 21170.0
Sell Stop 20590.0. Stop-Loss 20740.0. Take-Profit 20360.0, 20110.0, 19990.0, 19850.0
Overview and dynamics
Yesterday, global stock exchanges saw large-scale sales. But most of all, the American stock market suffered. The political crisis in the United States, aggravated in the US amidst the next buzz surrounding President Donald Trump, helped to withdraw investment funds from risky assets into safe assets, such as US government bonds, yen, gold.
US stock indices fell sharply on Wednesday after media reported that Trump (allegedly) had asked former FBI director James Komi, who was dismissed from his post a few days earlier, to stop the investigation against Michael Flynn, who previously held the position of an adviser President for national security. The news came after reports that Trump handed classified information to Russian authorities, which could harm the US national security. Against this background, talk of possible impeachment of Trump increased.
The yield of 10-year US Treasury bonds, according to Tradeweb, fell to 2.247% from 2.329%. Demand for gold on Wednesday increased sharply. The price of gold rose yesterday to around 1260.00 dollars per troy ounce, which is 1.9% or 23.00 dollars higher than the opening price of yesterday's trading day. It was the most noticeable daytime rise since March 16th.
The ICE dollar index, estimating its rate to a basket of six major currencies, fell by 0.4% to 97,685, nearing the minimum level since November 4, just days before Trump's victory in the US elections caused the US dollar to rise.
The main US indices at the end of the day suffered the most serious losses in a few months. The Dow Jones Industrial Average declined by 261 points (or 1.25%) to 20,718 points yesterday, Nasdaq Composite lost 1.7%, and the S & P500 lost 1.6%.
Nevertheless, despite the strong yesterday's decline, positive dynamics of US stock indices remains. As geopolitical tensions ease, investors will once again turn their attention to fundamental macroeconomic data from the United States. This will become the main fundamental driver in the near future.
Technical analysis
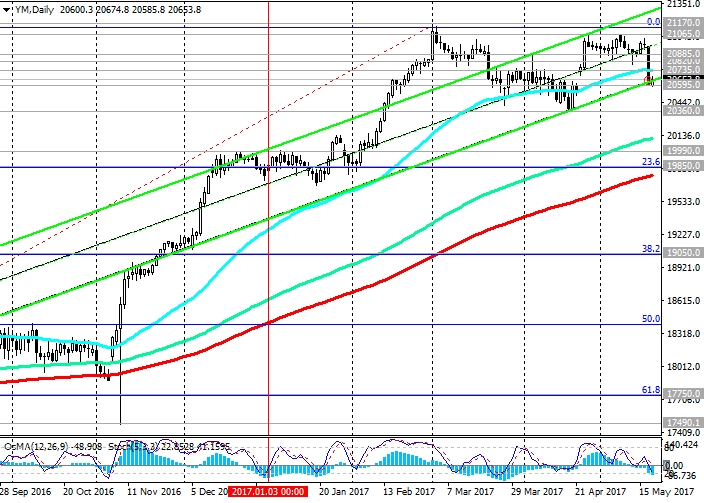
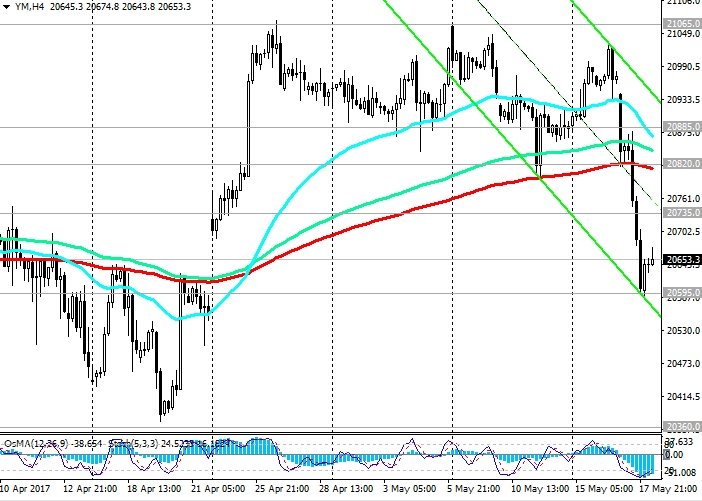
As a result of yesterday's drop, the DJIA index has lost all the achievements of recent weeks, falling to the opening level of the previous month near the mark 20650.0. The DJIA index broke short-term support levels 20885.0, 20820.0 (EMA200 on 1-hour and 4-hour charts) and fell to the support level of 20595.0 (the bottom line of the ascending channel on the daily chart).
With the opening of today's trading day, there is a recovery of indices.
The indicators OsMA and Stochastics on the 1-hour and 4-hour charts turned to long positions.
Positive dynamics of the index can fully recover already above the level of 20820.0. To open long positions in small lots can be tried already above the level of 20735.0 (EMA50 on the daily chart).
If the downward trend is to increase, the decline in the index may be continued to support levels of 20360.0 (April lows), 19990.0 (December highs), 19850.0 (EMA200 on the daily chart and Fibonacci level of 23.6% correction to the wave growth from the level of 15660.0 after recovery In February of this year to the collapse of the markets since the beginning of the year. The maximum of this wave and the Fibonacci level of 0% is near the mark of 21170.0). Further decline and breakdown of the level of 19850.0 can break the bullish trend.
Support levels: 20595.0, 20360.0, 20110.0, 19990.0, 19850.0
Resistance levels: 20735.0, 20820.0, 20885.0, 21065.0, 21170.0


