Bearish Reversal On Dow Jones Industrial Average

Published 05/29/2019, 01:30 AM
US500
-
DJI
-
IXIC
-
US10YT=X
-

If you’re a bull – don’t move. Bears, lean right on in as a break of this neckline could confirm a larger, bearish reversal on the Dow Jones Industrial Average.
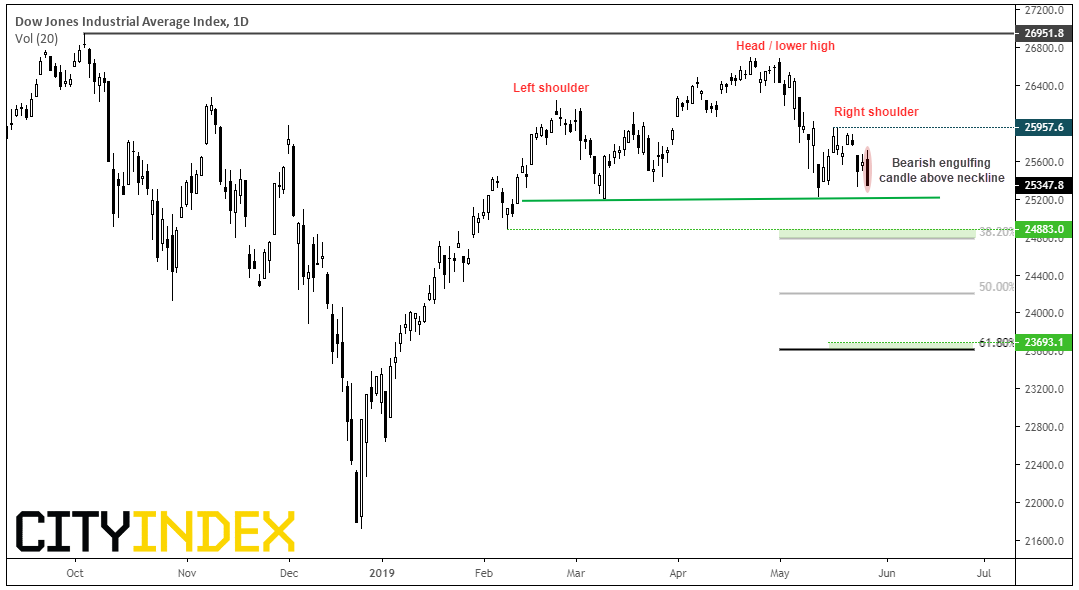
Dow Jones Industrial Average Index 1 Day

Last week we questioned the ‘rebound’ on the DJI. Citing unfavorable seasonality, false breaks on the S&P 500 and Nasdaq along with a potential ‘right shoulder’ on DJI, it suggested a potential head and shoulders reversal could be forming. Fast forward to yesterday’s close and the right shoulder is shaping up nicely with a bearish engulfing candle stalling just above the neckline.

  • If we are to see a break lower, we could use the support zone between the 38.2% Fibonacci level and 24,883 low as an initial (or intraday) target.
  • Alternatively, we could see if the neckline breaks and then is respected before considering a swing trade short.
  • If successful, the reversal pattern projects a target just above the 61.8% Fibonacci level.
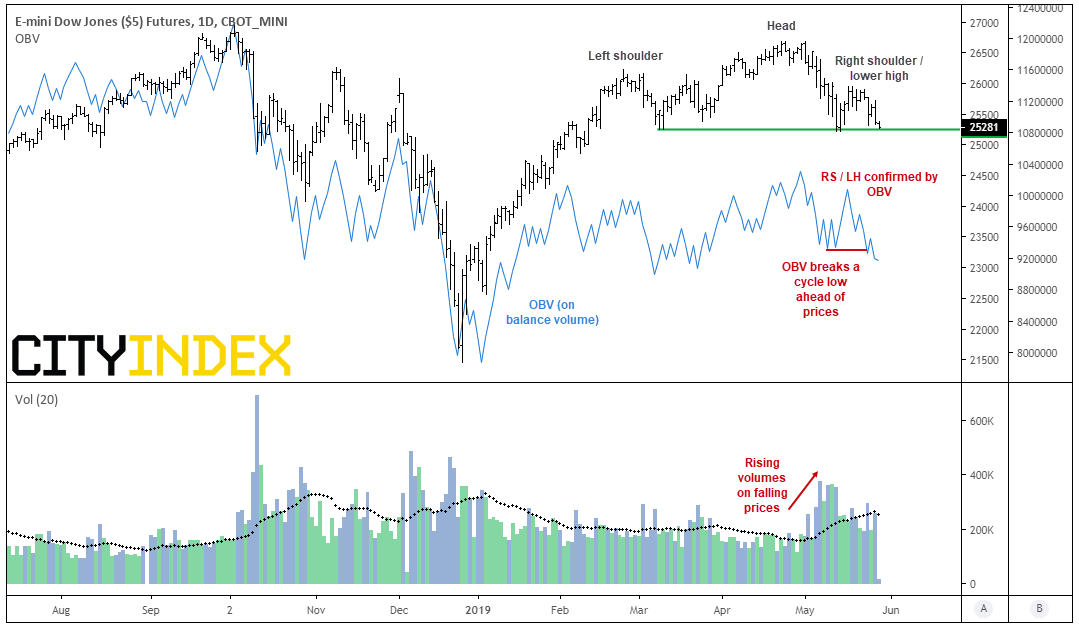
E-Mini Dow Jones

Moreover, volumes on the futures market also suggest bearish pressure is rising.

  • Volumes were rising as prices fell, following its peak (head)
  • OBV (on balance volume) confirmed the right shoulder / lower high and tracked the right shoulder to confirm the balance of bullish and bearish volume throughout
  • OBV has broken its cycle low ahead of prices breaking its own neckline, which can sometimes occur ahead of a breakout.

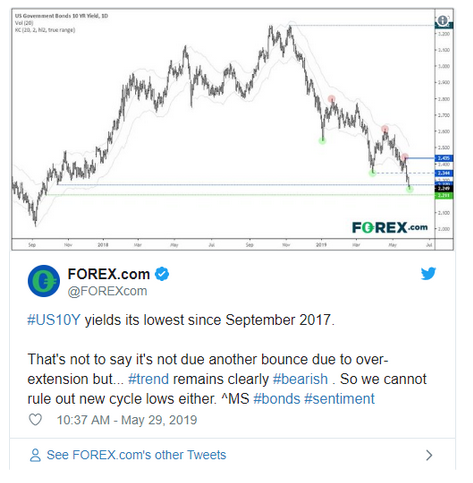
It’s interesting to note that DJI has stalled above its neckline as the US10Y yield hit a new cycle low (currently its lowest since September 2017). Currently trading beneath its lower Keltner channel, the argument for over-extension is on the rise – and we can see how it can bounce back if too far beneath it. If yields to rise from current levels, this could provide an opportunity for DJI to remain above this neckline but, given the bearish trend on yields, we suspect it could just be delaying the inevitable and for DJI’s neckline to eventually break. Either way, let price action be your guide.
Forex

Original post

Latest comments

Loading next article…
Risk Disclosure: Trading in financial instruments and/or cryptocurrencies involves high risks including the risk of losing some, or all, of your investment amount, and may not be suitable for all investors. Prices of cryptocurrencies are extremely volatile and may be affected by external factors such as financial, regulatory or political events. Trading on margin increases the financial risks.
Before deciding to trade in financial instrument or cryptocurrencies you should be fully informed of the risks and costs associated with trading the financial markets, carefully consider your investment objectives, level of experience, and risk appetite, and seek professional advice where needed.
Fusion Media would like to remind you that the data contained in this website is not necessarily real-time nor accurate. The data and prices on the website are not necessarily provided by any market or exchange, but may be provided by market makers, and so prices may not be accurate and may differ from the actual price at any given market, meaning prices are indicative and not appropriate for trading purposes. Fusion Media and any provider of the data contained in this website will not accept liability for any loss or damage as a result of your trading, or your reliance on the information contained within this website.
It is prohibited to use, store, reproduce, display, modify, transmit or distribute the data contained in this website without the explicit prior written permission of Fusion Media and/or the data provider. All intellectual property rights are reserved by the providers and/or the exchange providing the data contained in this website.
Fusion Media may be compensated by the advertisers that appear on the website, based on your interaction with the advertisements or advertisers.
© 2007-2025 - Fusion Media Limited. All Rights Reserved.