📈 Will you get serious about investing in 2025? Take the first step with 50% off InvestingProClaim Offer

Directions And Inflections For The Major U.S. Markets

Published 06/23/2014, 12:56 AM
Updated 07/09/2023, 06:31 AM
DJI
-
GC
-
VX
-
IXIC
-
DJA
-
SOX
-
OEX
-

It’s time to chime in on the VIX-heading-to-single-digits market of ours. I’ll just share a few words about each of the charts below.

First, the Dow Jones Composite: steady as she goes, I suppose. It has cleared its trendlines, and although it might, on occasion, ease back to that blue supporting trendline, there is nothing particularly vulnerable about this chart.

COMPQ Chart

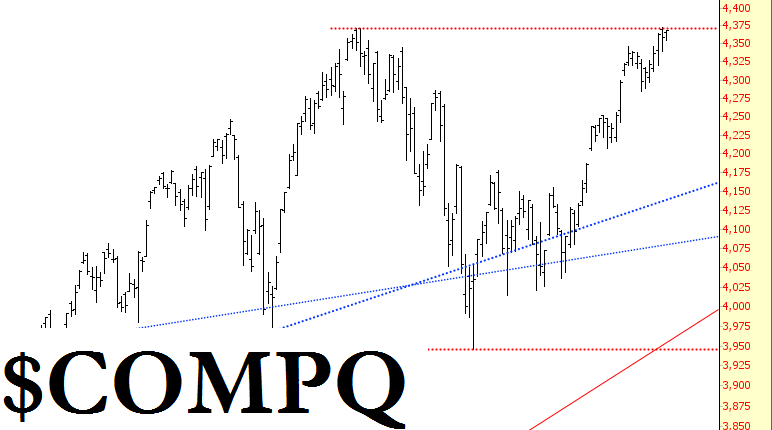
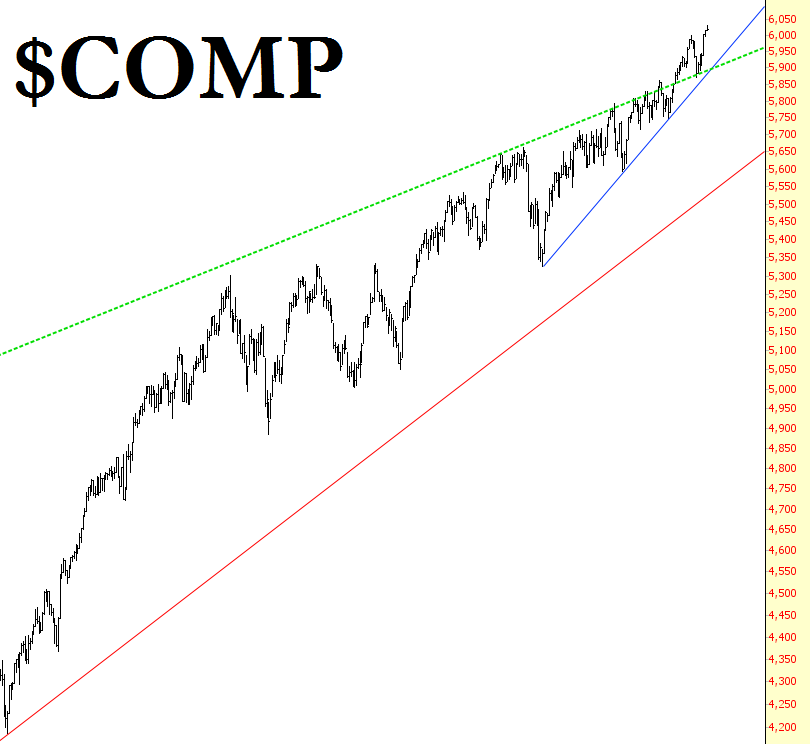
The NASDAQ Composite is a hair’s breadth away from its own breakout. If it instantly slumps on Monday at the open, sure, we might have a double top, but it seems more likely that it’ll just lilt right over that horizontal line and continue breaking out higher.

COMPQ Chart

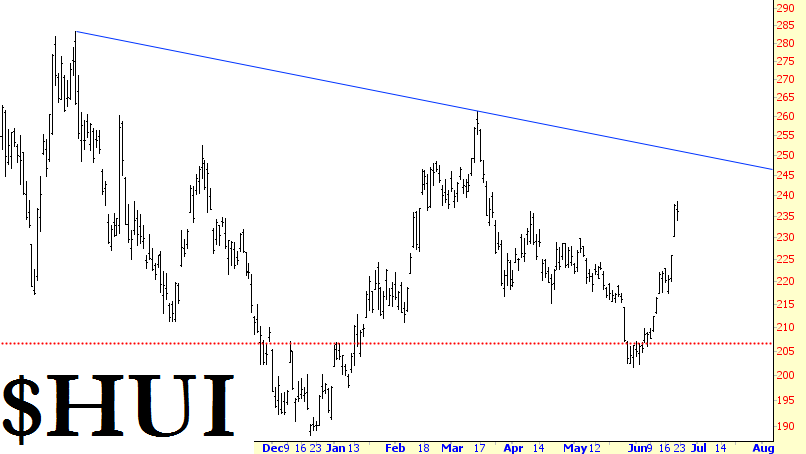
The gold bugs had a great week last week, of course, and I still think there’s room to roam higher, although I’m watching that descending blue trendline as the next pause point.

HUI Chart

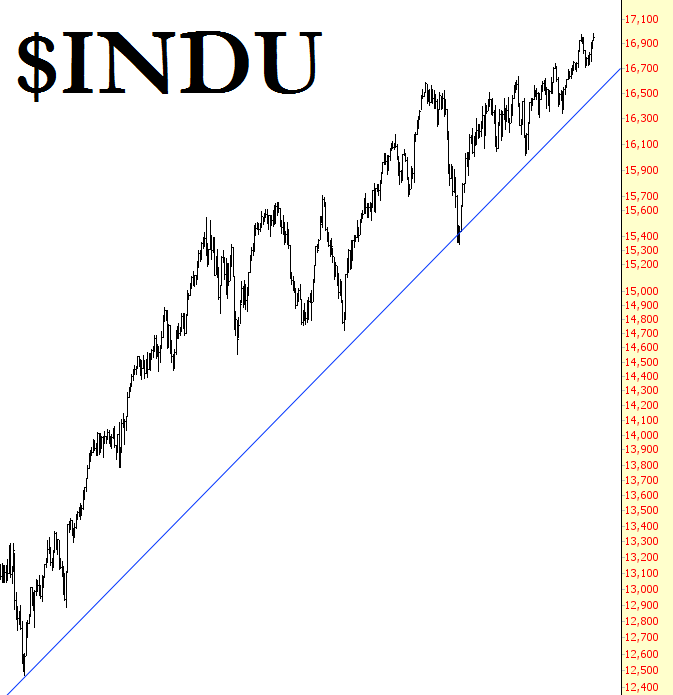
The Dow 30, like the Dow Composite, is in a positioned to move higher, and any weakness should be stopped by the blue trendline. Psychologically, there’s a lot of motivation in the market to reach the never-before-seen 17,000 mark, which is virtually a foregone conclusion at this point.

INDU Chart

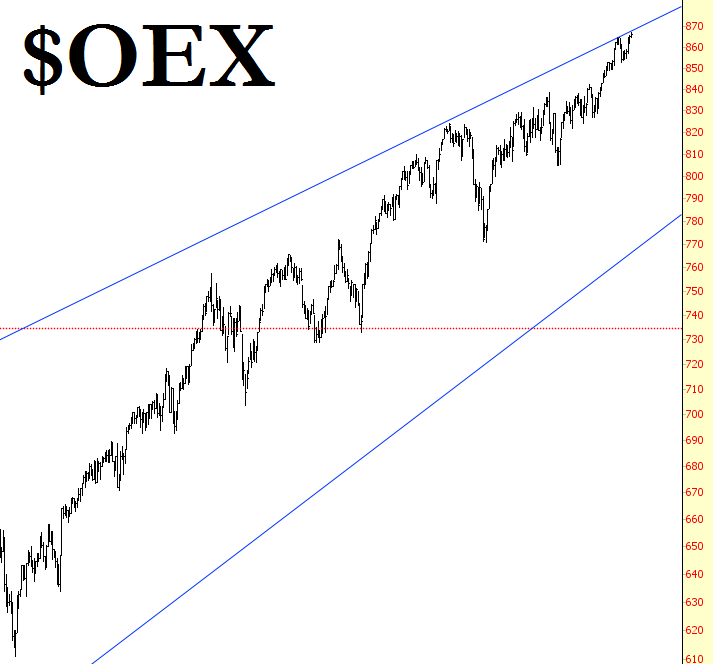
The OEX does a good job illustrating that, as well-position as the market is to move higher, it is definitely lofty, and I’d have difficulty making an argument for any significant strength in the weeks ahead. In other words, there is an opportunity for some very modest, nominal, “new highs again!” type gains, but with the market already at new highs, it would only have to eek out a tiny gain on a regular basis to accomplish this. We are not poised for any big move up anymore.

OEX Chart

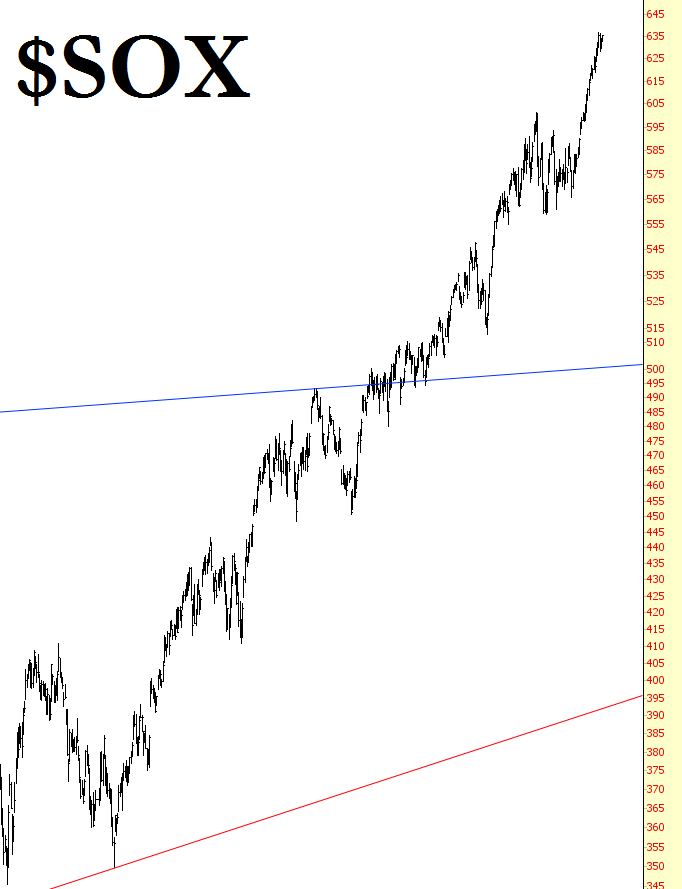
This point is amplified, I think, by the hockey stick chart known as the Semiconductor index:

SOX Chart

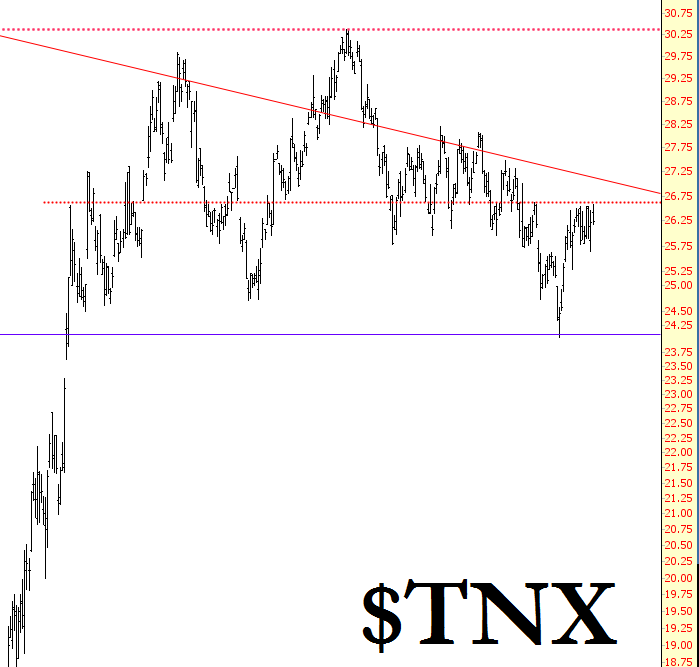
Lastly, interest rates are still unresolved. They are precisely at the decision point level which will either (a) push them above that trendline, wrecking the topping pattern, or (b) let them complete the topping pattern and, potentially, even break the blue line, which would send interest rates plunging and bond prices surging higher.

TNX Chart

Latest comments

Loading next article…
Risk Disclosure: Trading in financial instruments and/or cryptocurrencies involves high risks including the risk of losing some, or all, of your investment amount, and may not be suitable for all investors. Prices of cryptocurrencies are extremely volatile and may be affected by external factors such as financial, regulatory or political events. Trading on margin increases the financial risks.
Before deciding to trade in financial instrument or cryptocurrencies you should be fully informed of the risks and costs associated with trading the financial markets, carefully consider your investment objectives, level of experience, and risk appetite, and seek professional advice where needed.
Fusion Media would like to remind you that the data contained in this website is not necessarily real-time nor accurate. The data and prices on the website are not necessarily provided by any market or exchange, but may be provided by market makers, and so prices may not be accurate and may differ from the actual price at any given market, meaning prices are indicative and not appropriate for trading purposes. Fusion Media and any provider of the data contained in this website will not accept liability for any loss or damage as a result of your trading, or your reliance on the information contained within this website.
It is prohibited to use, store, reproduce, display, modify, transmit or distribute the data contained in this website without the explicit prior written permission of Fusion Media and/or the data provider. All intellectual property rights are reserved by the providers and/or the exchange providing the data contained in this website.
Fusion Media may be compensated by the advertisers that appear on the website, based on your interaction with the advertisements or advertisers.
© 2007-2025 - Fusion Media Limited. All Rights Reserved.