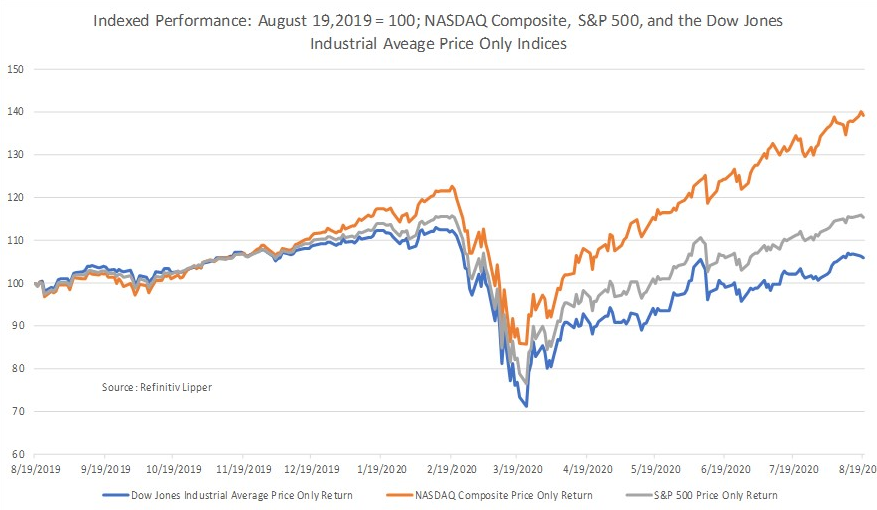
I was recently asked how I could explain the record outflows seen in domestic equity funds in July and the beginning of August given the meteoric rise of a few U.S. broad-based indices. With the NASDAQ posting its thirty-fifth record close for 2020 on August 20 and the S&P 500 closing at a record high on August 18, why were fund investors still in a risk-off mode?
Despite the COVID-19 related market meltdown in March, year to date through the Refinitiv Lipper fund-flows week ended Wednesday, August 19, 2020, the Dow Jones Industrial Average was down only 2.96%, while the tech-heavy NASDAQ Composite Price Only Index was up a whopping 24.23% for the same period. In fact, looking at returns since the market low on March 23, 2020, both indices have risen a handsome 48.95% and 62.47%, respectively.
However, fund investors have not been chasing performance. Perhaps a recollection of the pain and carnage caused by the 2000-2003 Dotcom bubble and 2008 Financial Crisis has kept investors on the sidelines this round.
In fact, despite handsome 2019 returns for both equity (+24.04%) and taxable fixed income funds (+7.75%), investors still padded the coffers of money market funds to the tune of $541.6 billion for the year as many felt the longest bull market in history (2009 through 2019 and really through February 20, 2020) was getting a little long in the tooth.

For 2019, investors were net redeemers of equity fund and ETFs assets, withdrawing $196.8 billion for the year, while injecting net new money into taxable bond funds and ETFs ($316.6 billion), $541.6 billion into money market funds, and $96.5 billion into municipal bond funds. So, it is not too surprising to see similar trends continue even during this stellar market rise since March given the ongoing fears of COVID-19 and concerns over Sino-American trade talks.
Three points come to mind that might explain the ongoing exodus from U.S. domestic equity funds.
1. Core-And-Satellite Strategy
First, Baby Boomers were advised to use a core-and-satellite investment strategy years ago in which they invested a large chunk of their wealth into the perceived safety of domestic large-cap funds (the core portion of the strategy). The other portion of their wealth was earmarked for lower- or non-correlated assets, such as international funds, small-cap funds, commodities funds, real estate investment trusts (REITs), and bond funds.
After a few decades of investing using a core-and-satellite strategy, Baby Boomers had amassed a large portion of their assets in domestic large-cap funds and began preparing for the drawdown of their accounts for retirement, moving their assets to bond funds, diversifying across other assets classes, and slowly paying for those days on the beach or golf course.
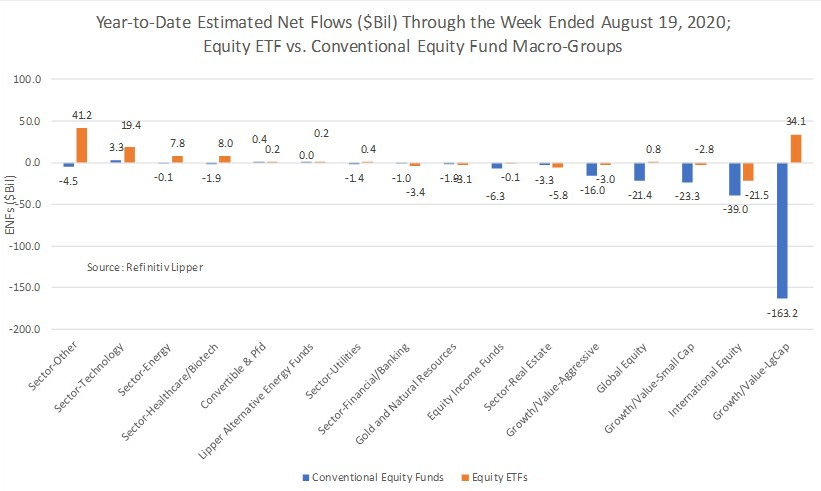
For 2019, domestic large-cap funds (-$103.2 billion, including ETFs) accounted for more than half of the net redemptions from equity funds. The same pattern continues so far in 2020. While equity funds handed back a net $207.3 billion year to date through August 19, large-cap funds (including ETFs) accounted for $129.1 billion of those net redemptions. And money market funds (+$871.2 billion), taxable bond funds (+$86.2 billion, includes ETFs), and municipal bond funds (+$10.7 billion) have been the benefactors as investors, particularly Baby Boomers, have been reallocating their portfolios to income-producing, capital sparing, and in some cases safe-haven securities.

2. Exchange-Traded Products: Inflows And Outflows
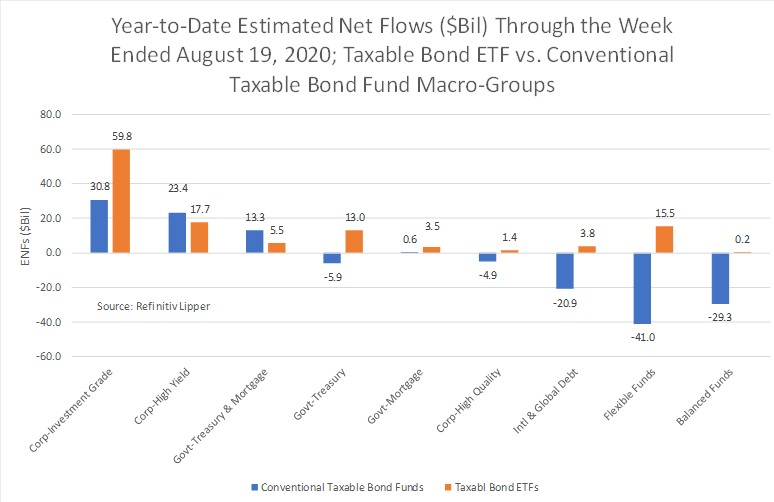
That brings us to point number two: investors have embraced the benefits of low cost, tax-efficient exchange-traded funds. Equity ETFs have taken in $72.3 billion so far in 2020, with large-cap ETFs witnessing net inflows of $34.1 billion. That means conventional large-cap equity funds (-$163.2 billion) have suffered even larger outflows than the top-line number shown above implied, and Commodities Precious Metals ETFs and Science & Technology ETFs attracted the next largest sums, taking in $36.0 billion and $19.4 billion, respectively, year to date. But perhaps more telling is the year-to-date net inflows of $120.3 billion into taxable bond ETFs. Despite stingy yields across the board, many investors continue to search for yield, and bond ETFs have been a primary recipient.

3. Risk Aversion
Lastly, as gleaned in the first example, investors have become ultra-risk averse, pouring money into money market funds (+$882.6 billion, a record amount for any given full year) year to date. Even with the strong equity market performance, we saw in 2019, investors had injected a net $541.6 billion into money market funds, probably remembering the pain and longevity of prior market meltdowns. With the unemployment rate coming in at 10.2% for July and new COVID-19 cases still upsetting the opening of the global economy, embracing this new market rally appeared to be too big of an ask for investors’ comfort (particularly those Baby Boomers preparing for or already in retirement).
