Trump can tweet, but are traders really buying it?
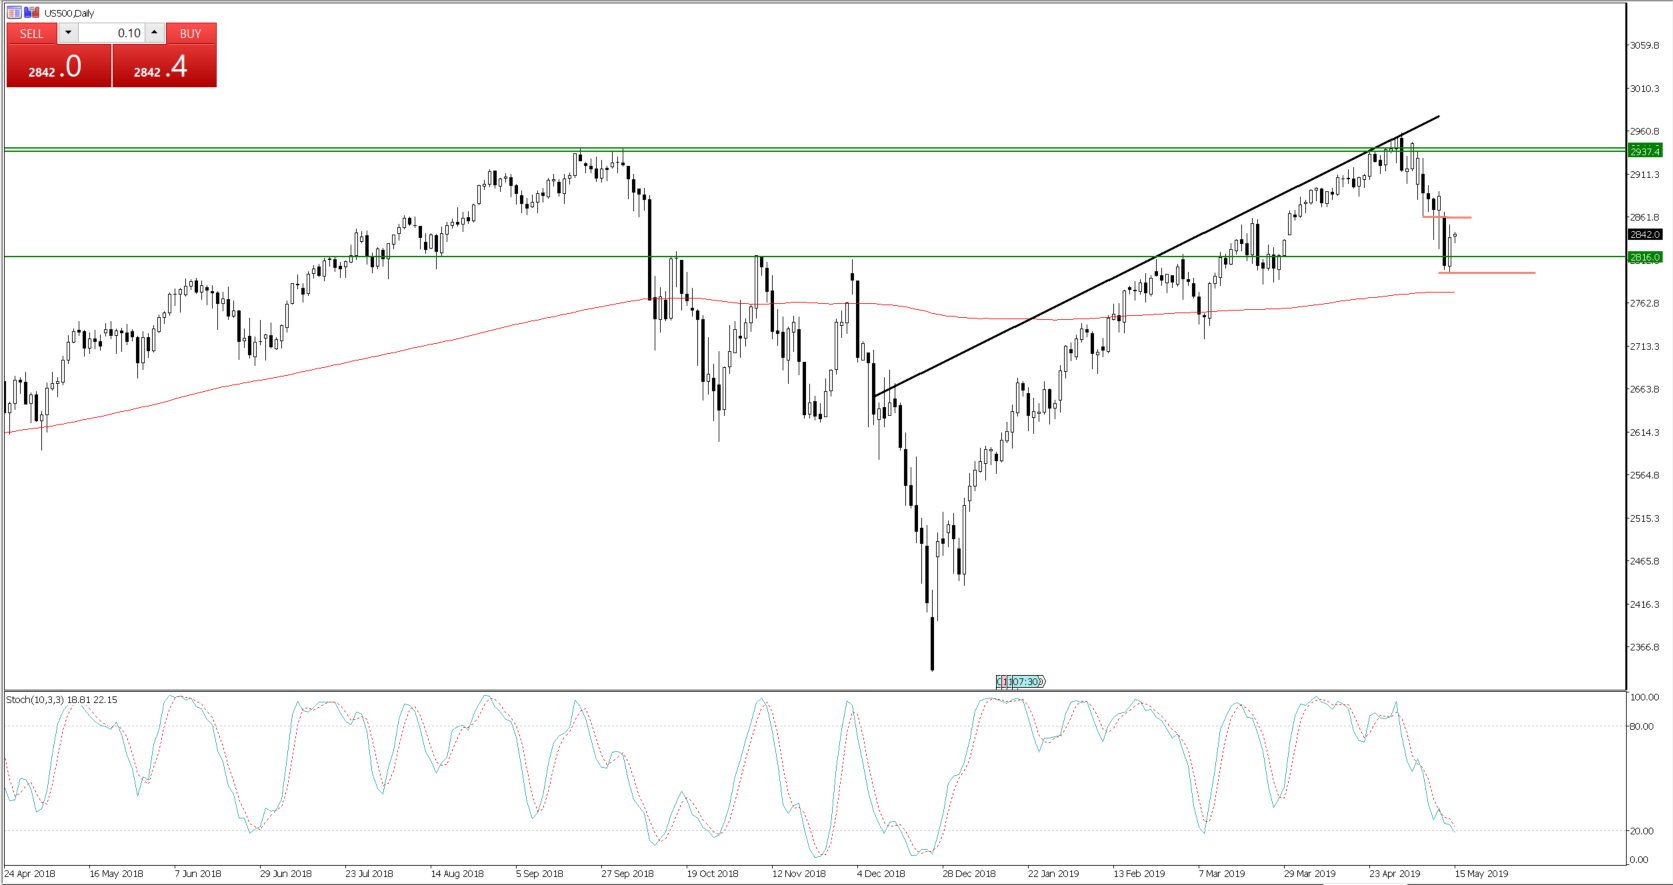
It seems a futile exercise to quote all of Trump’s overnight tweets, but needless to say, they were aimed squarely at putting a bid back into the stock market, which he sees as a voting mechanism on his tenure as president. A 5% move lower in the S&P 500 into 2800, and a lift in volatility has seen financial condition tighten enough that we are seeing the response.
The question is whether Trump would have been happy with a 0.8% rally in the S&P 500, given the sheer extent of his equity-focused jawboning? I am not so sure he would, and while we have seen high yield credit spreads narrow 5bp vs investment-grade credit and small caps outperforming, it feels the market just hasn’t truly bought into it. Consider then, this article in Axios. It made its way around the floors, quoting a senior Trump administration official who suggested a deal isn’t even close, and that he couldn’t see a resolution until the end of the year. Parallels with Brexit have naturally been drawn, which is a talking point in itself and has GBP traders lifting the offer, with GBP/USD now eyeing a break of the 25 April low of 1.2866.
With the European elections late next week, cross-party talks (between the Tories and Labour) close to collapse, and talk of another, likely failed, vote through the Commons. It seems Theresa May’s days are numbered and the prospect of her resignation next month is higher than ever. It is hard to be long on the GBP here, and I have moved to a far more neutral stance on GBP/AUD. One to watch.
The S&P 500 continues to define global equity markets, and until we push back through the 2865/90 supply zone, I feel traders will favour selling into this move. I remain short-term bearish, even if Asian markets are looking more constructive today and would certainly add to short exposures on the Dow, Nasdaq and S&P 500 if we saw sellers kick into gear again, with a close through 2800 (on the S&P 500) opening the door for a test of the 200-day MA at 2775. So, 2800 is my line in the sand, with a break here likely resulting in the VIX index trading north of 25%, which would accelerate flows into US Treasuries and the JPY. So, I am happy to admit defeat and reduce on a move higher through 2865, while adding to shorts through 2800.

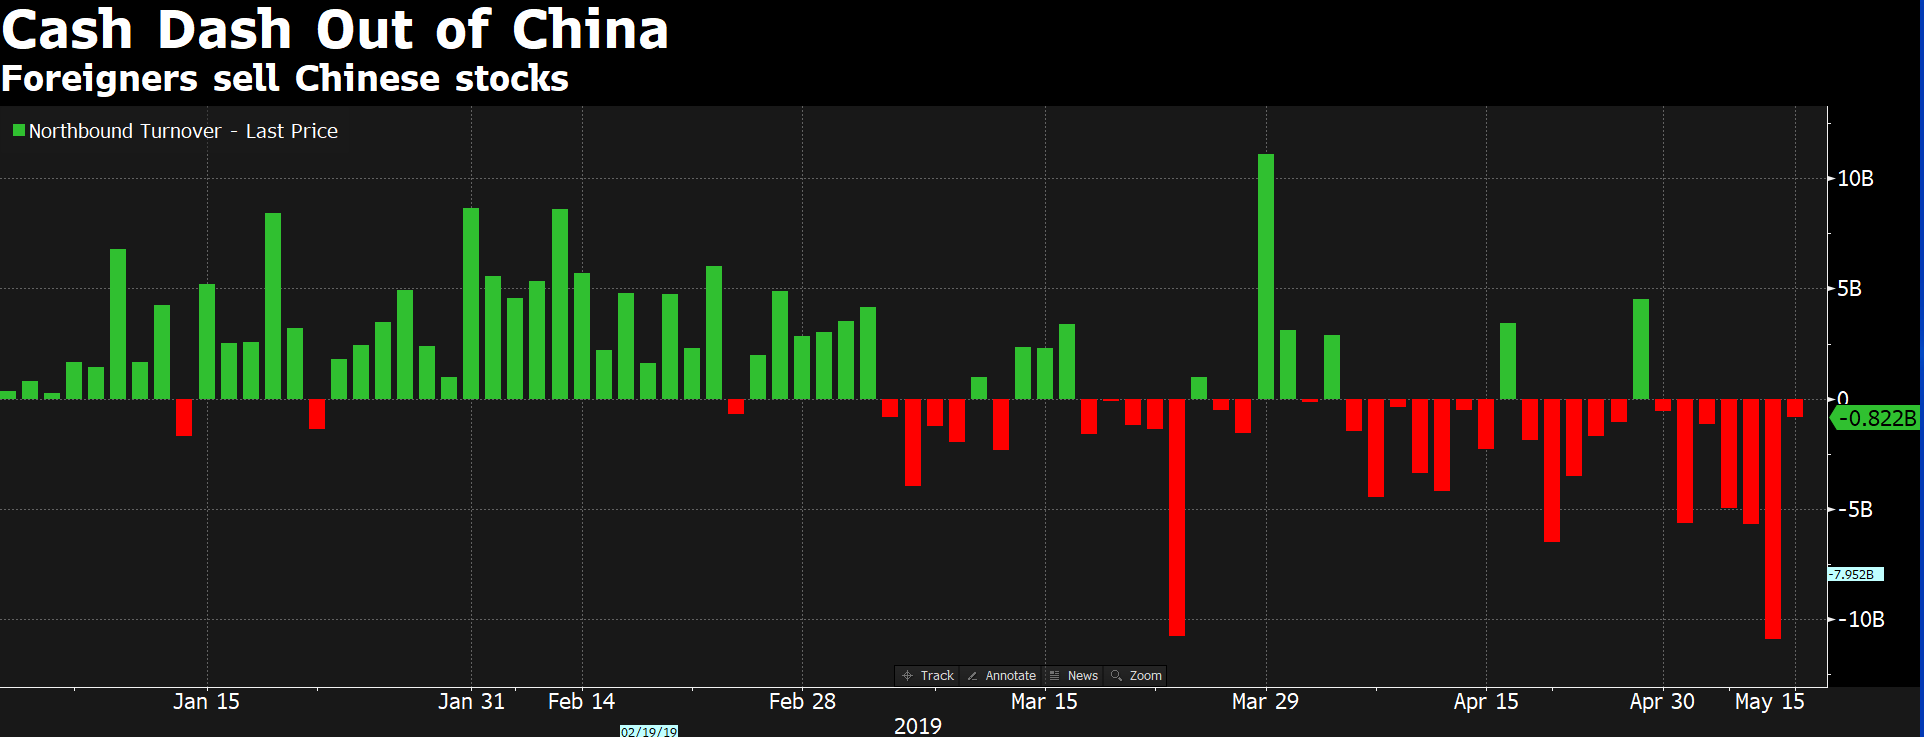
A threat to my ST cautious bias is that we see continued constructive flows into Chinese equities, with the China A50 index (CN50 on MT4/5) pushing 1.4% higher. In turn, we see stability in the ASX 200 (+0.6%) and S&P 500 futures (+0.2%), what’s more, there has been little negative reaction, in any of these markets, to today’s China data dump, with April industrial production coming in at 5.4% (vs 6.5% eyed), retail sales at 7.2% (8.6%) and fixed asset investment at 6.1 (6.4%). Considering the sizeable outflows through the Shanghai-HK ‘connect’ of late, it's amazing to think China is higher on the day.

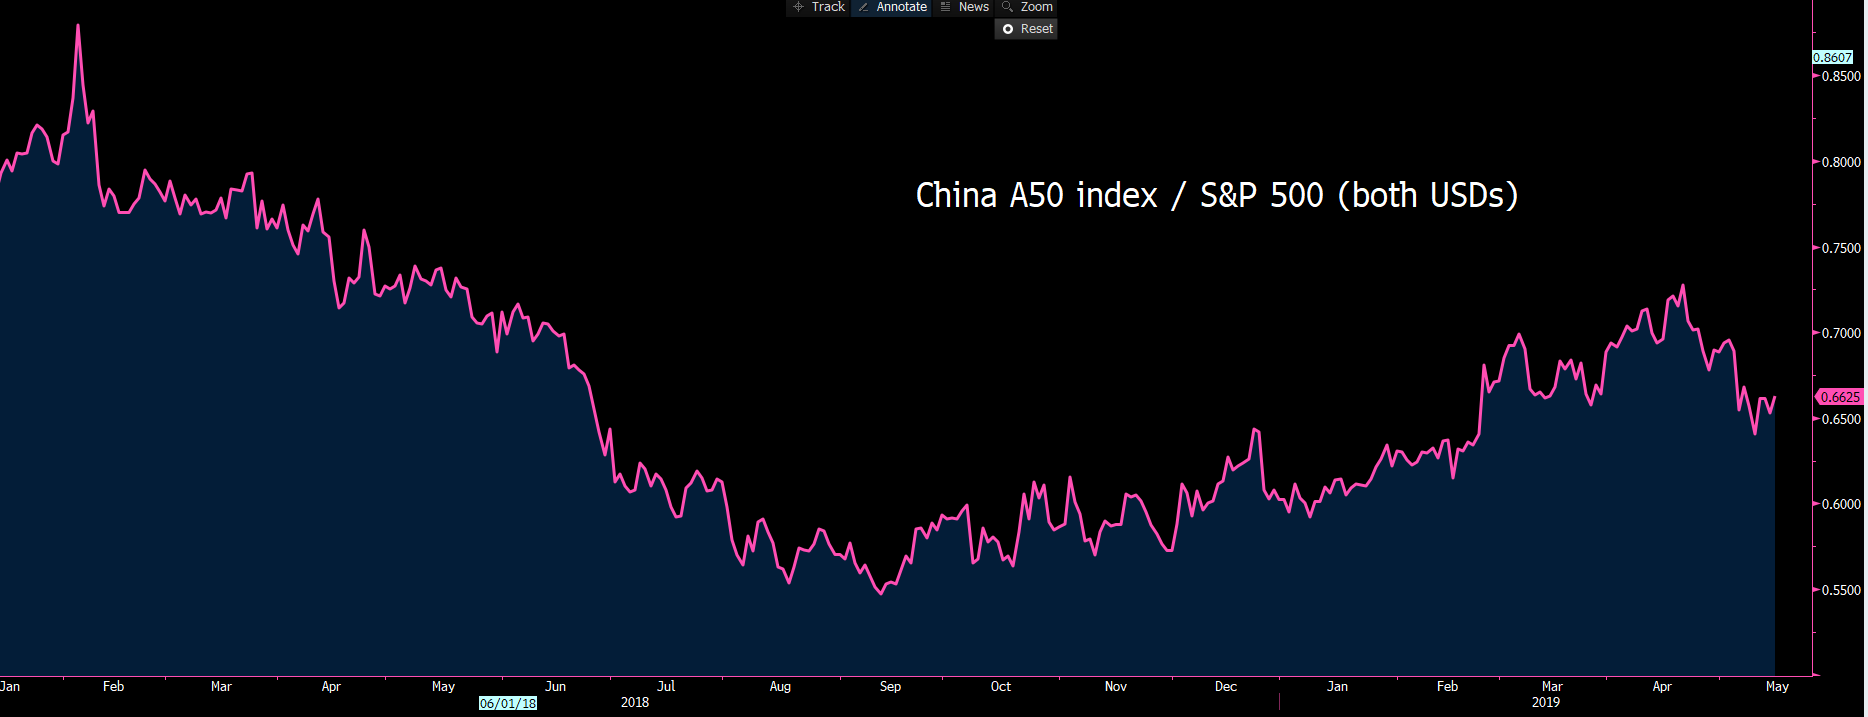
Clearly, the calls for stimulus are increasing, while the pride of buying domestic in these testing times could be giving stocks a helping hand. Perhaps the real battle is in the stock markets, so I am watching the A50 index/S&P 500 ratio, with both legs priced in USD, as a guide.

Interestingly though, despite Chinese equities finding buyers, there has been no love for the AUD, with AUD traders focused squarely on the CNH.
With that in mind, USD/CNH is flatlining today, and the moves from the Chinese authorities are certainly making it more expensive to be short CNH. That said, 1- and 3-month hibor rates are not at levels which will truly discourage CNH shorts just yet, but they are curbing the one-way move. AUD/JPY is working within a bearish channel and continues to hold the 5-day EMA, and with the trend extended, we can see an ‘inside day’ candle and that needs to rectify itself – use Tuesdays high and low as our guide here for future directional trends.
Aussie Q1 wages hit the market today at 11:30aest, portraying the growth of 0.5%QoQ, which was just shy of the consensus estimate of 0.6%. The year-on-year clip remained unchanged at 2.3% and, as such, the reaction through the AUD has been minimal, with Aussie 3-year Treasury unchanged on the day at 1.238%. The prospect of a June cut from the Reserve Bank has gained 2ppt to 40.4%.
SEK/JPY has been a good short and one I have spoken about of late, and I have this pair on high watch, as buyers are having a better say and a daily close above the 5-day EMA and I am out, with price looking to put in a base, but I will wait for confirmation to lock in profits.
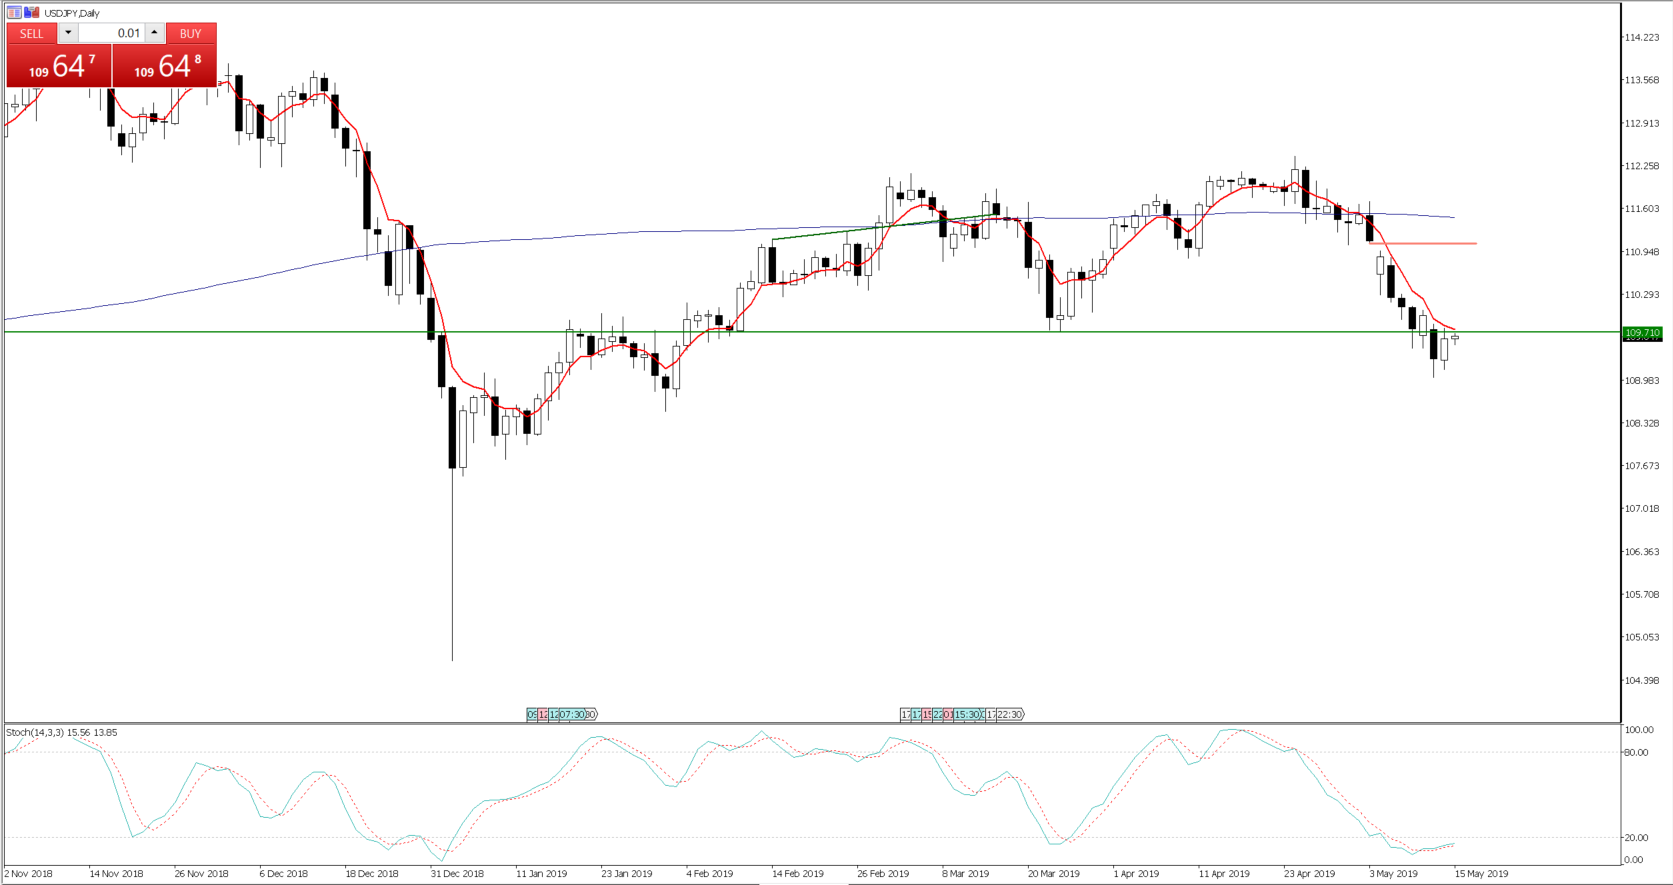
USD/JPY is just holding below the 109.71 pivot and the 5-day EMA as well, which has defined the move lower since the gap down on 3 May. This makes life very interesting because a rejection of resistance would get a lot of attention on the floors and suggest a target of 107.25. Consider that at 22:30aest tonight we get US retail sales and that may have an influence on the USD, even if the driver of price moves remains, unfortunately, on social media influences. The market expects a 0.2% lift in the April retail data read, with the ‘control group’ element, the group of goods that feed directly in the Q2 GDP calculation, expected at 0.3%. Keep in mind we don’t see the US Q2 GDP print until 26 July, but we do know the Fed keep a close eye on consumption, so depending on the outcome of the print (relative to expectations) and we could see the USD sensitive to this.

To provide context, the implied move in USD/JPY on the session is 38-pips, so traders are not seeing huge volatility in the session ahead.
