In the last 50 trading days, the SPX has recorded a nearly 38% return which is the fastest 50 trading day return in the history of the index. A big reason for that is a rally in “cyclical” sectors—sectors of the stock market that are supposedly closely correlated with the real world economic cycle.
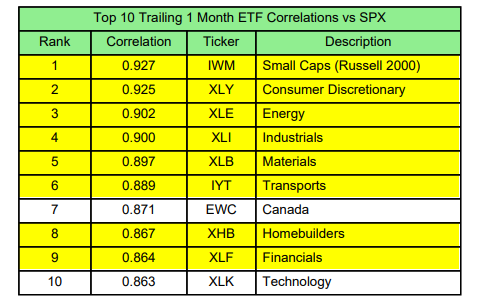
Such sectors are represented by a variety of funds: iShares Russell 2000 ETF (NYSE:IWM) (small caps), Financial Select Sector SPDR® Fund (NYSE:XLF) (financials), Consumer Discretionary Select Sector SPDR® Fund (NYSE:XLY) (consumer discretionary), Energy Select Sector SPDR® Fund (NYSE:XLE) (energy), Industrial Select Sector SPDR® Fund (NYSE:XLI) (industrials), Materials Select Sector SPDR® Fund (NYSE:XLB) (materials), iShares Transportation Average ETF (NYSE:IYT) (transports) and SPDR® S&P Homebuilders ETF (NYSE:XHB) (homebuilders). Over the past month, these cyclical ETFs have had the highest correlations to SPX. As those sectors have rallied so has the SPX.
This leads to a strange disconnect in which investors are bombarded with very bad economic data—millions of job losses every week—while simultaneously, stocks are rallying. What is going on?
The stock market takes its cues about the economy from cyclical stocks which not only form 40% of the index but also supposedly take their cue directly from the economy. This is where the disconnect comes from.
The recent performance of cyclical stocks doesn’t really reflect the economy. Why?
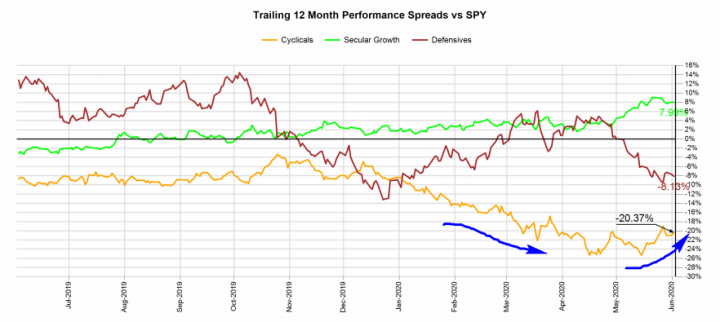
For one, cyclical stocks were excessively beat up during the selloff in March as investors crowded into secular sectors such as Technology Select Sector SPDR® Fund (NYSE:XLK) (technology) and Health Care Select Sector SPDR® Fund (NYSE:XLV) (health care). Trailing 12 month returns of cyclical sectors lagged the SPDR S&P 500 (NYSE:SPY) by as much as -25%, a historically large disconnect.
At some point a mean reversion was inevitable and in the last 2 months that is exactly what we have seen. Super cheap stocks became slightly less cheap. Cyclicals have narrowed their underperformance to only -20%.
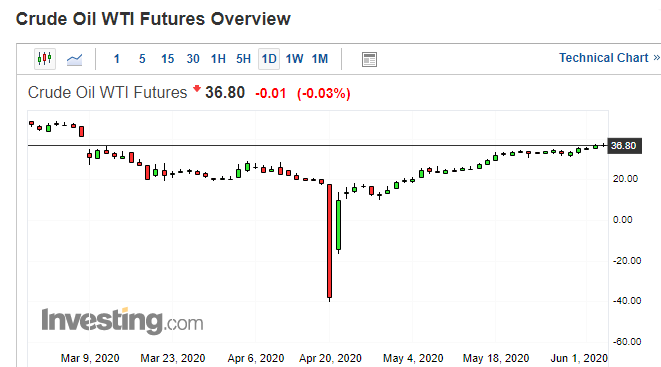
Much of that narrowing can be attributed to recovering oil prices. After the shock of negative CL (crude oil) prices in April, CL has rallied rapidly to about $36. That makes it easier for energy companies to service their corporate debt and is generally bullish for their junk bonds and stocks. That in turn reduces credit spreads which is bullish for junk bonds ETFs like the iShares iBoxx $ High Yield Corporate Bond ETF (NYSE:HYG) and financials which lend to energy companies. Once you get XLF and XLE going, all cyclical sectors start to experience inflows as broad asset managers start to buy all cyclical sectors in bulk.
The problem with this benign picture is the reason why oil prices are going up. They are not going up because demand in the economy is improving. Rather, they are going up because supply has been drastically cut.
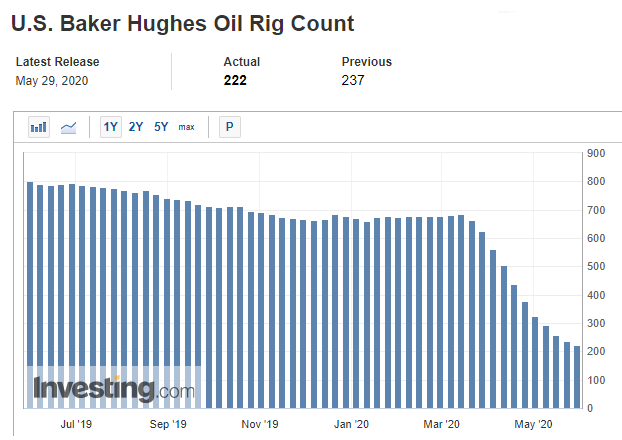
OPEC+ announced big production cuts in April and is currently undergoing negotiations for even more cuts. In North America, the rig count has been cut from 670 at the start of the year to 222 in the latest reading from May 29th. This is a -66% decrease in just a few months.
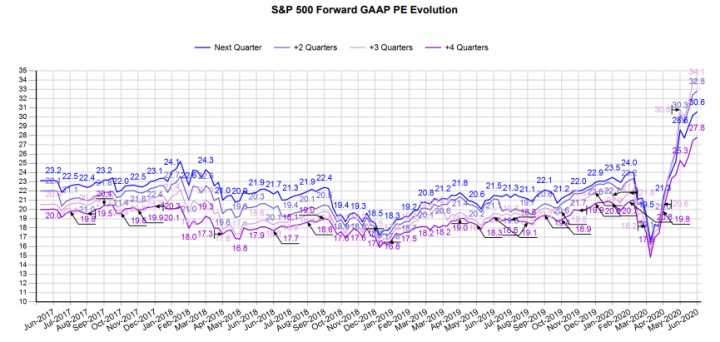
The price of oil is drawing a misleading picture of the economy. From there, via algorithmic trading which depends so heavily on correlations, stocks are getting the wrong message as well. This type of market misinformation can last a long time and can be responsible for a buildup of very big valuation excesses. SPX Forward GAAP PE multiples are now above 34 which are levels only seen once in the past during the Dot Com Bubble. Eventually, cyclical stocks will complete their mean reversions, will start to underperform again and will lead the stock market to the downside again.
A big problem now is that this time the market has potential to fall further and sharper since its discrepancy to the economy and corporate earnings is even bigger than in February when forward PEs were at multi-decade highs near 24. And we know what happened in March.
