The Biden administration is looking to increase spending on cybersecurity with the next round of stimulus. This comes after an increase in cyber-attacks across the world which has targeted government agencies and groups. For the U.S, one of the most recent attack was a ransomware attack on the Colonial Pipeline along the east coast.

As this year’s tech boom in the U.S. economy started with the surge in prices from pandemic lows, the demand for more security across several sectors has naturally grown.
Additionally, with more tech-driven crypto mining plus electric and autonomous driving cars, the demand for cyber-security protection will only escalate.
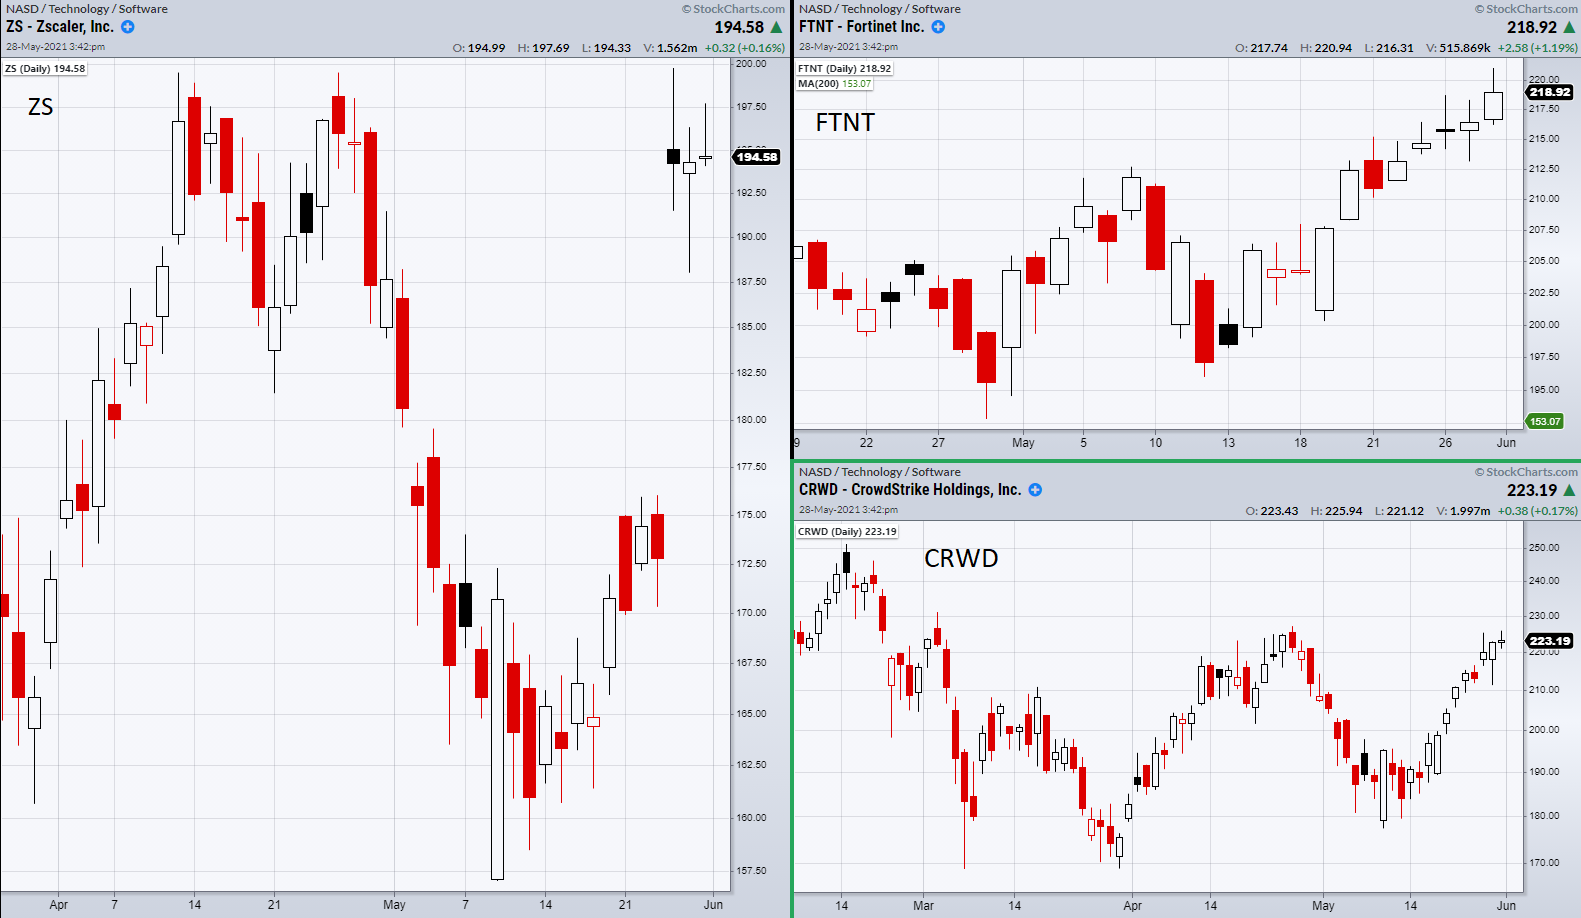
Three interesting companies to keep a watch on in this space, from a technical standpoint, include CrowdStrike Holdings (NASDAQ:CRWD), Zscaler (NASDAQ:ZS) and Fortinet (NASDAQ:FTNT).
Both ZS and CRWD are in bullish phases with the price over the 50-Day moving average but are also close to pivotal resistance areas.
CRWD will need to clear and hold over $227.20 before continuing its trek to all-time highs at $251.28.
ZS also has resistance nearby at $200. Its recent gap, paired with small trading range days, make it look vulnerable unless it can clear $200 and hold it as new support.
On the other hand, FTNT has the strongest momentum of the three and looks to continue breaking news highs. Watching FTNT for a pullback down to a recent high around $212 or a larger correction towards a major moving average might be the best way to play this pick going forward.
With that said, the cybersecurity mega-trend does not look to be subsiding anytime soon and with more thriving tech companies building their base from last year's financial crisis, the long-term demand should continue.
ETF Summary
- S&P 500 (SPY) Resistance 422.82. Momentum has not increased this past week on Real Motion.
- Russell 2000 (IWM) 226.69 resistance area.
- Dow (DIA) Like to see this hold over 345.
- NASDAQ (QQQ) Next resistance 336.65 with 329.59 support.
- KRE (Regional Banks) 68.16 support. 71.82 resistance.
- SMH (Semiconductors) 242.86 new support.
- IYT (Transportation) 278.85 next resistance.
- IBB (Biotechnology) Needs to hold 151.13.
- XRT (Retail) 96.16 resistance.
- Volatility Index (VXX) 36.04 resistance.
- Junk Bonds (JNK) 108.73 support.
- XLU (Utilities) Inside day.
- SLV (Silver) 25.23 support.
- VBK (Small Cap Growth ETF) 276.65 the 50-DMA.
- UGA (US Gas Fund) 34.68 resistance area.
- TLT (iShares 20+ Year Treasuries) 140.60 resistance. 138 pivotal.
- USD (Dollar) Held over 89.95 the 10-DMA.
- MJ (Alternative Harvest ETF) Needs second close over the 50-DMA at 21.30.
- LIT (Lithium) 64.25 support.
- XOP (Oil and Gas Exploration) 92.24 resistance.
- DBA (Agriculture) Watching to clear 18.74.
- GLD (Gold Trust) Minor support the 10-DMA at 176.49.
