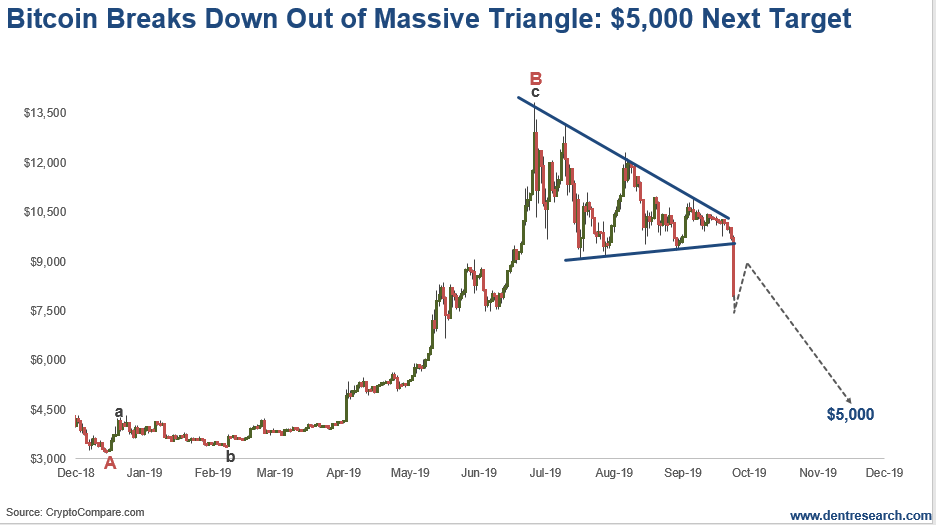
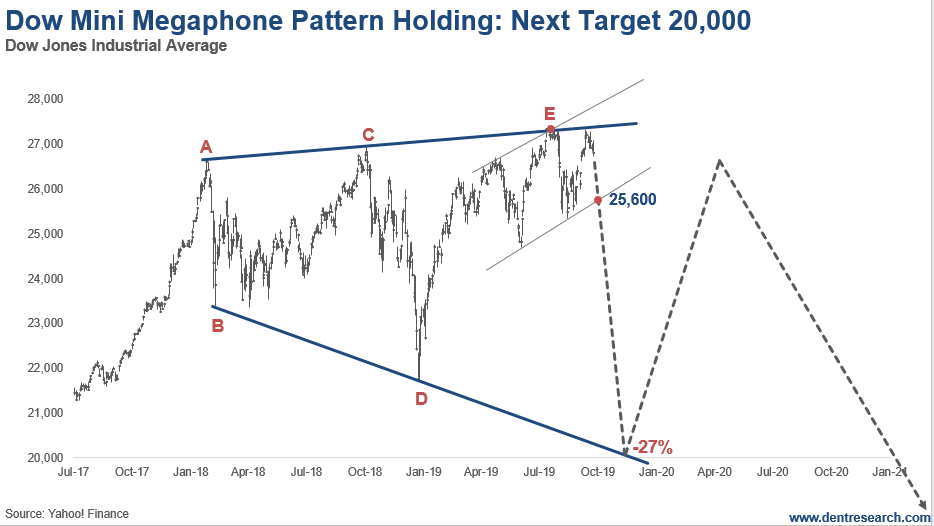
In our 5 Day Forecast last Monday for Boom & Bust subscribers, I highlighted two scenarios – one for stocks and one for Bitcoin – that looked imminent to break up or down sharply.
Well on Tuesday, Bitcoin made its break down out of a large triangle pattern that was coming to a make-or-break point. This is worse as the more typical pattern would be to break out in the same direction it came into the triangle, i.e., up.

This was no shabby break. Bitcoin was down over $1,500 – $1,000 of that in 30 minutes – as it first broke key resistance at $9,400. The next move is often as large as the widest part of the triangle, which would be about $4,400, or about a $5,000 target from that break-out point at the bottom trend line.
Why Is This Important?
I have been using Bitcoin as the final, steep bubble in this second broader tech bubble, as the young and super-overvalued internet stocks were in the last tech bubble.This key break after an already too-long correction in my $32,000 final bubble projection strongly invalidates that option and makes this likely a B-wave or bear-market rally top back at $13,827 in late June. The ultimate low before a 17-year or so bull market like the internet stocks would be at a minimum the $3,170 low last December. I would project more back to the bubble origin in late April 2017 around $1,250 – $1,300.No run to $32,000 on Bitcoin, no final blast to 10,000 on the Nasdaq – by my best calculations.
The Megaphone Pattern Continues
So, that leaves my second scenario with a completed megaphone pattern for the Dow and S&P 500 – and a likely final top for them. In last week’s 5 Day Forecast I also showed the chart of the Dow’s mini megaphone pattern that was due to be tested soon – and the markets were not able to push even to slight new highs to complete that pattern.

The megaphone pattern is simply one of higher highs followed by lower lows, until you get that third high, which now looks like it was back in July at 27,399. This one completes a larger megaphone pattern with peaks in 2000, 2007 and now. The lowest next target would be at that bottom trend line of lower lows at around 20,000. That’s a 27% drop and larger than the September-to-December crash in late 2018.
But in this scenario, there was always a final run at a new high that fails. Trump has been begging for stronger rate cuts and a resumption of QE. Powell has resisted looking like a lapdog. But a stock crash of this magnitude and more signs of weakening, like continued falling Treasury bond yields and rising gold prices, would give the Fed ample excuse to turn the heat back on big time. What does a “market on crack” most want? More crack.
A Perfect Time To Sell Stocks
Here’s the subtlety that most analysts will not catch if this scenario plays out: The Nasdaq is also in a mini megaphone that is a little broader that just put in the third- or C-wave top. A crash to around 5,700 would set it up to make a slight new high around 8,500+ on this final all-out stimulus rally while the Dow and S&P fail to make new highs. That would be a classic divergence and a sign of a major top.
A break of the light bottom line of the recent channel line-up at around 25,600 would further confirm this scenario along with a deeper, but not final crash. The best target for the sharp wave down would be around early-to-mid November. The final top of the Nasdaq could correspond with Andy Pancholi’s strongest turn point in late April/early May at The Market Timing Report.
This is a good time to lighten up or sell stocks. A break to new highs in the Nasdaq by early May next year would be the final signal. Put options to hedge would be another good strategy here. And again if we see that final rally at slight new highs for the Nasdaq next year.
