🍎 🍕 Less apples, more pizza 🤔 Have you seen Buffett’s portfolio recently?Explore for Free

Crosseyed And Painless: From DJA To SPX

Published 05/26/2016, 12:34 AM
Updated 07/09/2023, 06:31 AM
US500
-
DJI
-
US2000
-
IXIC
-
DJA
-

As much as I’d love to pretend things are just hunky-dory, they’re not. This market has (for me, at least) really been a nightmare lately. The big picture bear tops aren’t broken (yet!) but after last Thursday, the bulls have been gaining power and momentum.

Looking at the Dow Jones Composite, the descending channel is still completely intact, and all the up and down action over the past couple of months may ultimately turn out to be nothing more than just another pattern-within-a-pattern in the context of a generally descending market.
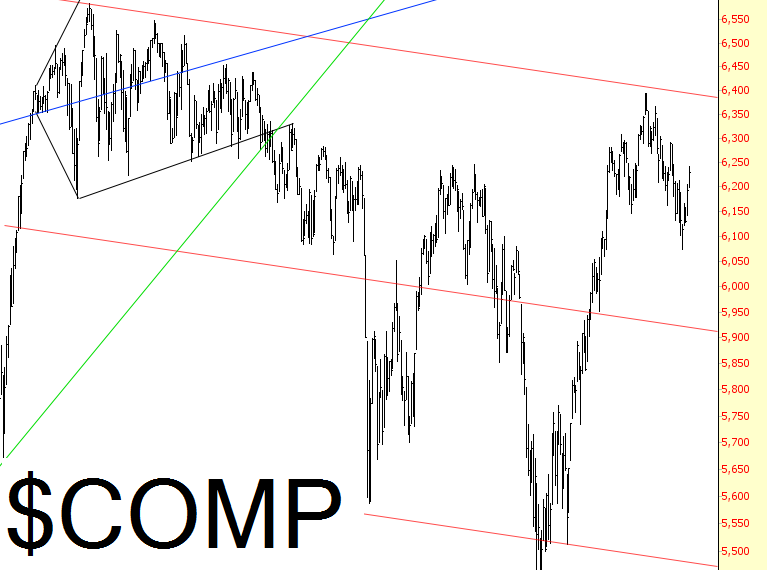
Dow Jones Composite Chart

The NASDAQ Composite is a more horizontal configuration, and we’re approaching a gap (indicated by the red horizontal lower line).
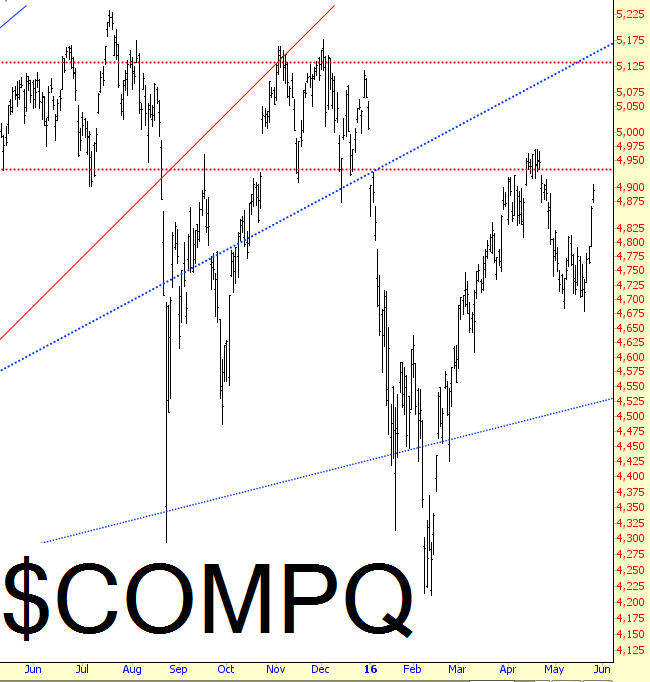
NASDAQ Chart

If we look close at a more specific Dow index – – the 30 industrials – – we can see that the series of lower highs is intact, but barely (yellow tints). In just a few trading days, we’ve rocketed about 600 points off the Thursday lows.
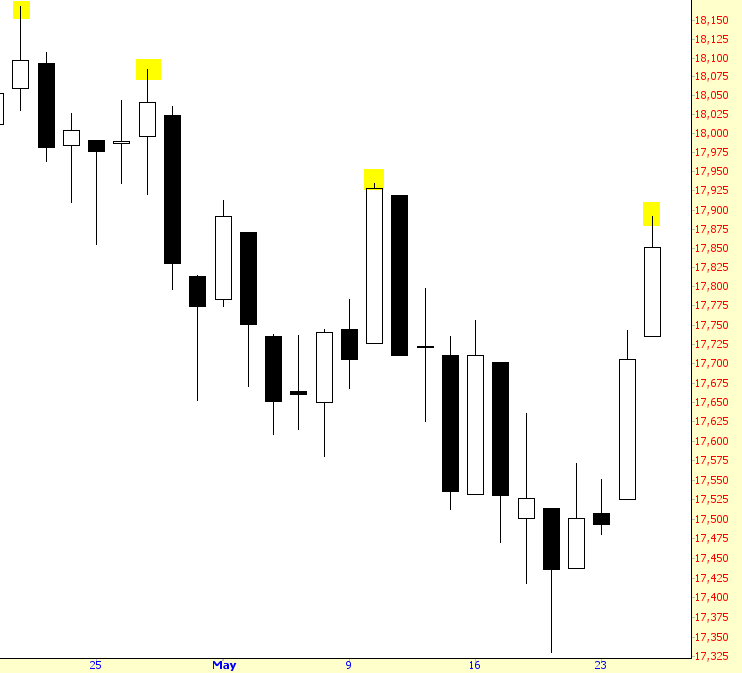
Dow Jones Chart

The Russell 2000 is a more complex pattern, and its own lower horizontal line is likewise an important area of resistance. I’ve got to say, I’ve been surprised at the strength of the market overall (and energy stocks/financial stocks in particular), so these “important” levels of resistance are being swept aside.
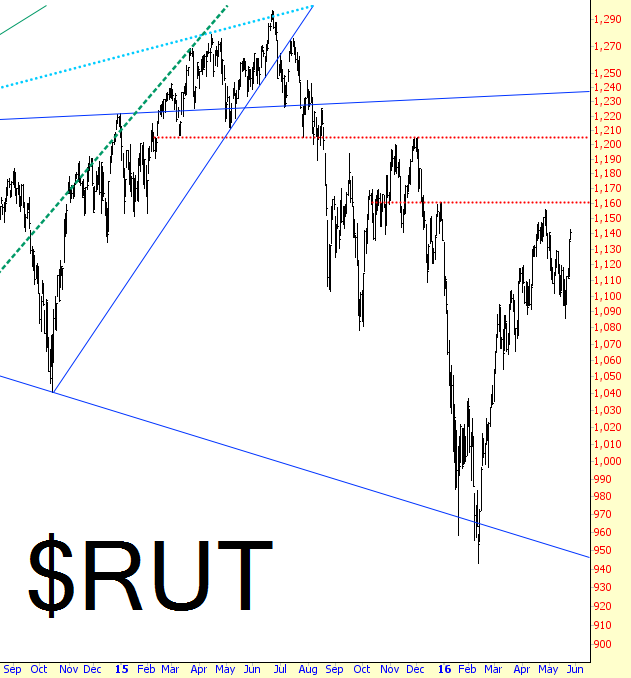
RUT Chart

If I can chart my disappointment in a single graph, it would be the S&P 500, shown below. The green tinted area was the picture perfect topping pattern. Last Thursday, it started breaking down, and the birds were singing and the lion was lying with the lamb.

Then……….things started going wrong (cyan tint), although it wasn’t a house-wrecker yet. Then Tuesday and Wednesday loaded a paper bag full of dog crap, lit it on fire, dropped it on my porch, and rang the doorbell. My portfolio looks a lot like the bottoms of my shoes right now.
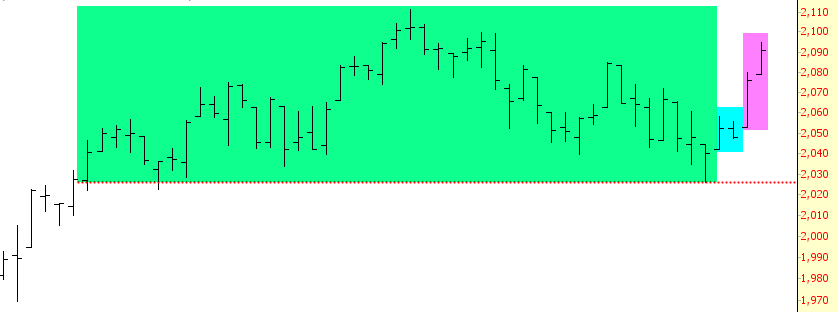
SPX Chart

So I’ve gone from a perfect portfolio (73 shorts on Thursday, 100% of which were profitable) to a far lighter portfolio of 54 shorts with, ummm, not 100% profitability. I’ll continue to retreat with my embattled troops if the market keeps ascending. At this point, I’m just taking it one day at a time. Hardly a pithy way to close this post, but………honest.

Latest comments

Loading next article…
Risk Disclosure: Trading in financial instruments and/or cryptocurrencies involves high risks including the risk of losing some, or all, of your investment amount, and may not be suitable for all investors. Prices of cryptocurrencies are extremely volatile and may be affected by external factors such as financial, regulatory or political events. Trading on margin increases the financial risks.
Before deciding to trade in financial instrument or cryptocurrencies you should be fully informed of the risks and costs associated with trading the financial markets, carefully consider your investment objectives, level of experience, and risk appetite, and seek professional advice where needed.
Fusion Media would like to remind you that the data contained in this website is not necessarily real-time nor accurate. The data and prices on the website are not necessarily provided by any market or exchange, but may be provided by market makers, and so prices may not be accurate and may differ from the actual price at any given market, meaning prices are indicative and not appropriate for trading purposes. Fusion Media and any provider of the data contained in this website will not accept liability for any loss or damage as a result of your trading, or your reliance on the information contained within this website.
It is prohibited to use, store, reproduce, display, modify, transmit or distribute the data contained in this website without the explicit prior written permission of Fusion Media and/or the data provider. All intellectual property rights are reserved by the providers and/or the exchange providing the data contained in this website.
Fusion Media may be compensated by the advertisers that appear on the website, based on your interaction with the advertisements or advertisers.
© 2007-2024 - Fusion Media Limited. All Rights Reserved.