NASDAQ 100 – (QQQ)
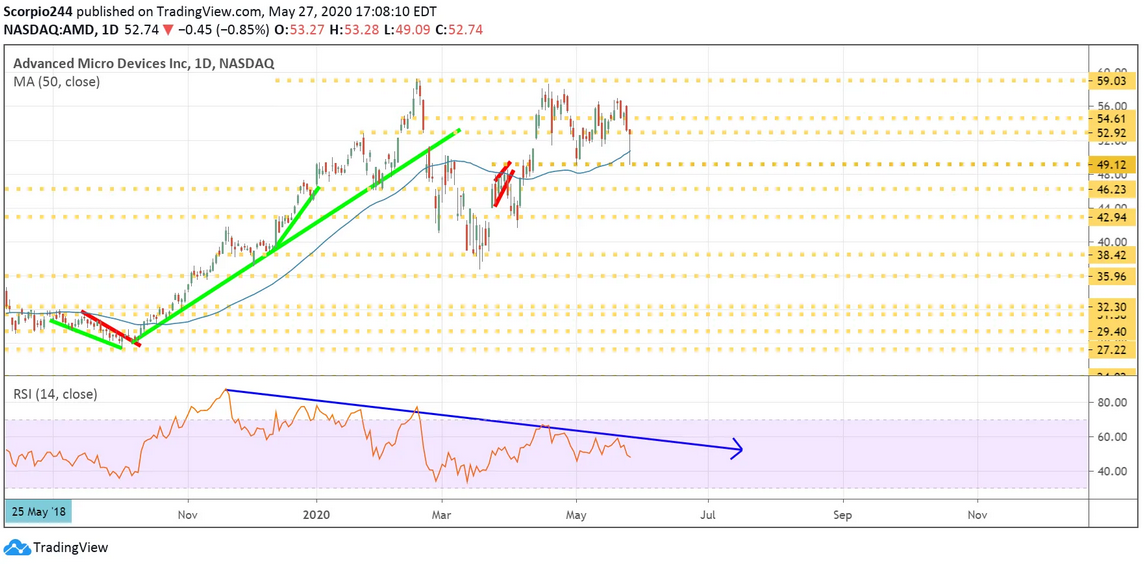
The trading channel of the Nasdaq 100 is rather amazing. We get this 4 to 5% drawdowns rather quickly only to reverse right off the base of the channel. Yesterday's price action was beyond bizarre, and I’m not sure what to attribute it too, to be honest. The one positive piece of news that came out during the day was Micron (NASDAQ:MU) raising guidance for this coming quarter.
There was a tremendous buy imbalance today at the close, worth nearly $3 billion it certainly helped to push the indexes higher in the last hour of trading. I talked about a few other things that may be at play here, regarding options and dealer positioning that is likely influencing much of this.
Until something changes with this pattern in QQQ, one has just to continue to respect it and trade it accordingly.
S&P 500 (SPY)
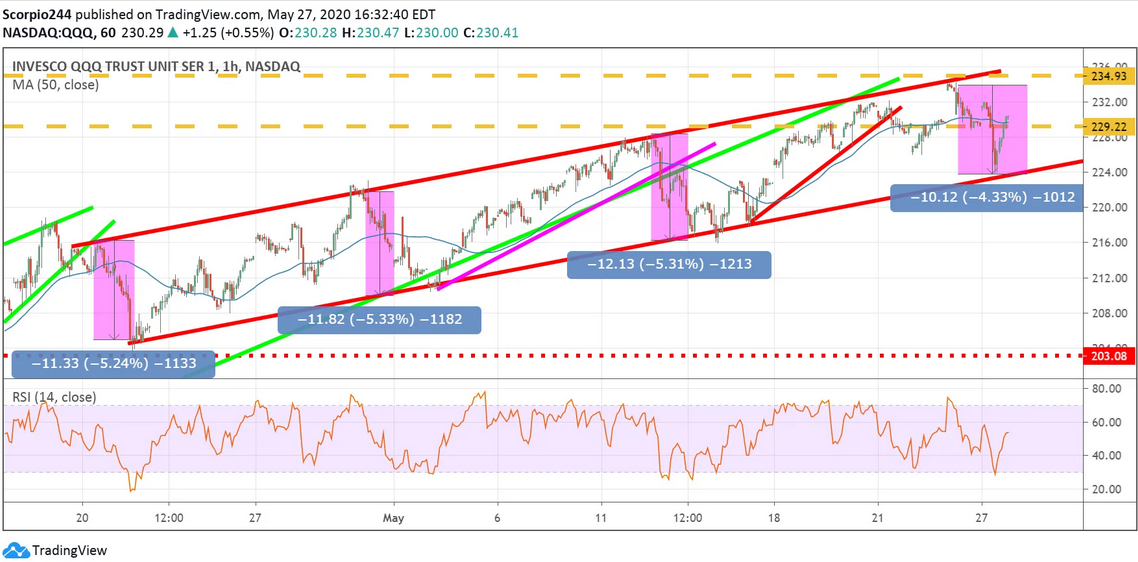
The S&P 500 was strong Wednesday, mostly because the banks continued to rally. It would have been a significantly different day had the banks not been so strong again.
Is it real buying or short-covering, impossible to tell. For now, the S&P 500 continues to hold just below the April 3 uptrend. The RSI also finally broke out of its range, confirming the move up, and likely suggests that momentum can continue higher for a bit longer. It seems like for whatever reason that 3,100 appears to be the level the market wants to hit. Currently, we are trading at 17.9 times 2022 earnings estimates of $170 per share, an insanely high level for 2-year forward earnings estimates.
Micron (MU)
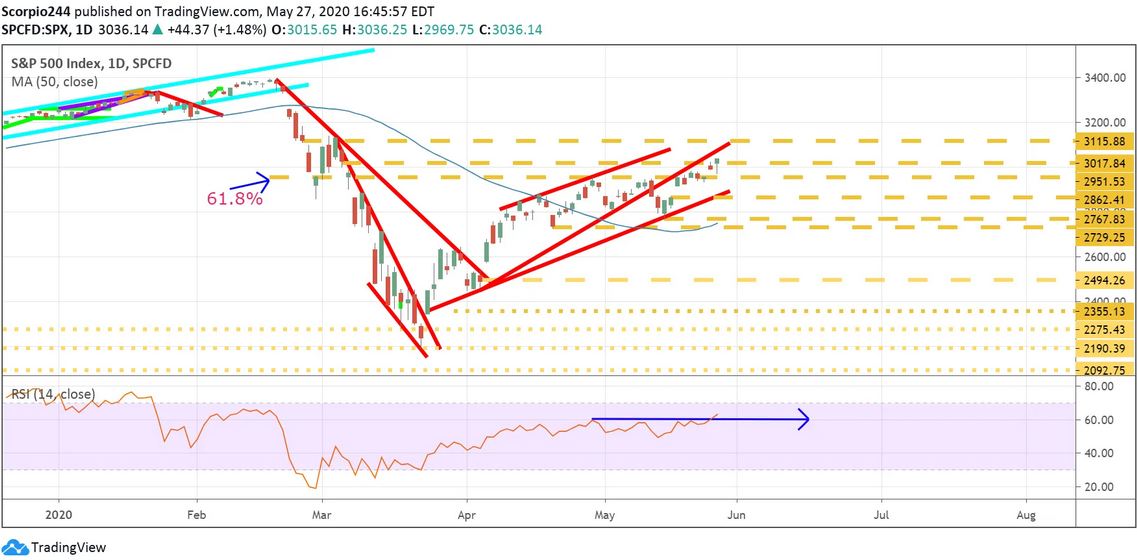
Micron raised its guidance yesterday rather significantly, with earnings now in the range of $0.75 to $0.80 per share, versus consensus of $0.56. Meanwhile, revenue guidance rose to $5.2 billion from $5.4 billion, versus estimates of $4.92 billion. However, they did note; they were uncertain they could sustain the momentum into the fiscal fourth quarter, due to the coronavirus. Still, shares jumped to resistance at $49.80. That fills a gap that was created on March 9, and so now the stock needs to break out. If it can great, it probably goes up to $52.75.
Roku
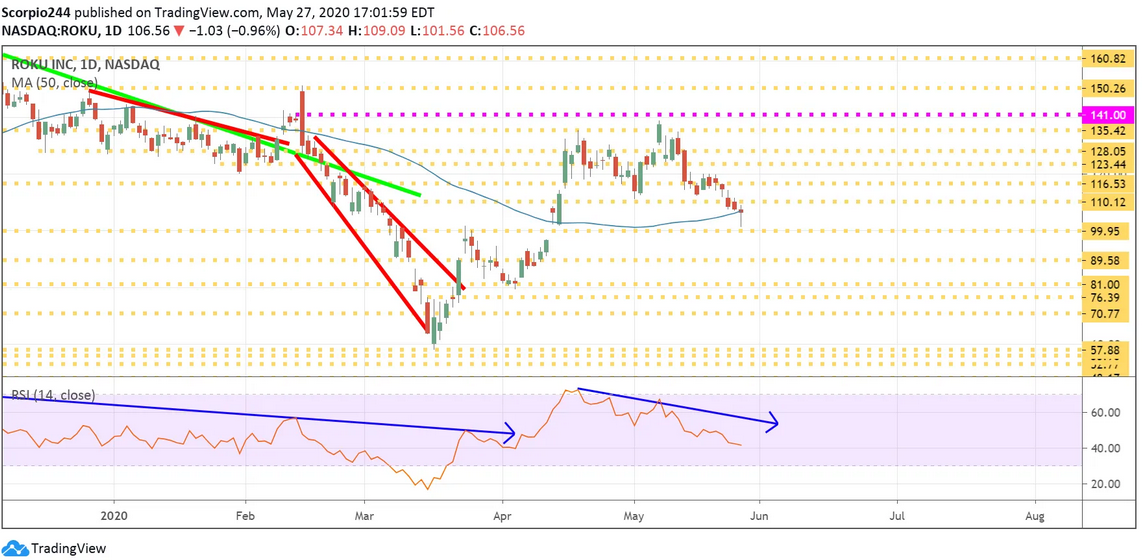
Roku (NASDAQ:ROKU) fell yesterday as well, to around $101, right near the $99 to $100 level I laid out earlier this week. Close enough for me. Momentum is still lower based on that RSI, and a break of $99 sends it to $90. It seems possible. I will have to think more about it.
NVIDIA
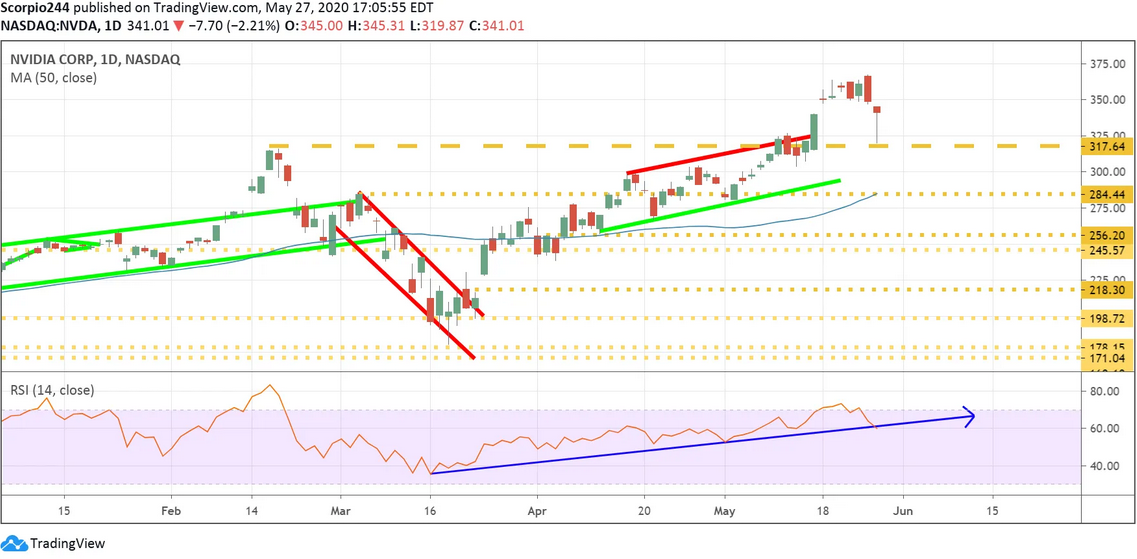
NVIDIA (NASDAQ:NVDA) was hit pretty hard but managed to hang on to support at $317. For now, momentum is higher, but I’m not sure for how long. Today will be telling.
AMD (AMD)
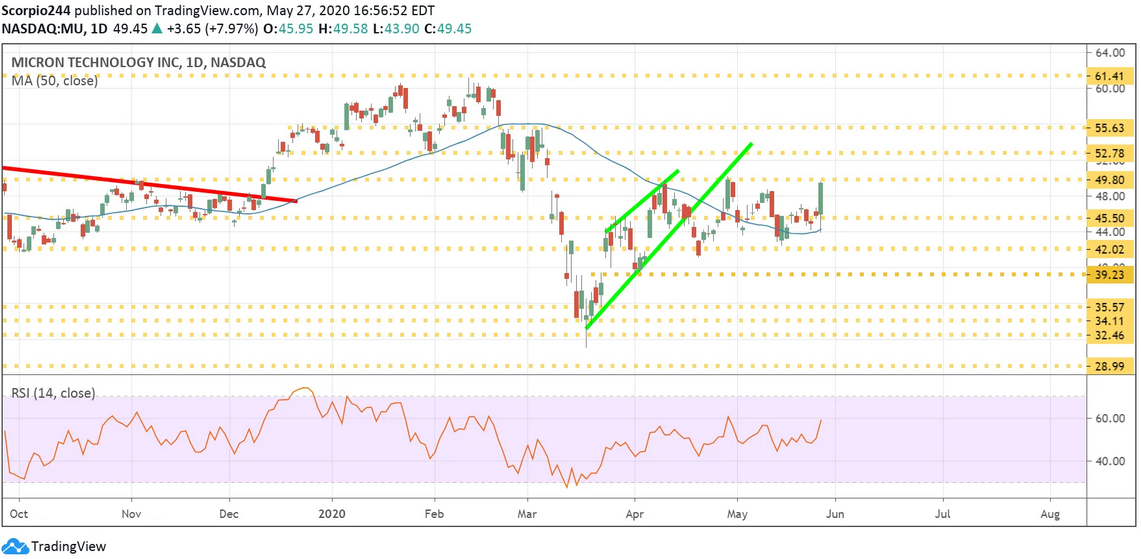
Advanced Micro Devices (NASDAQ:AMD) touched support at $49.15 and bounced hard. Even with the bounce, momentum is still lower. Probably will test that level again.
