Following futures positions of non-commercials are as of September 11, 2018.
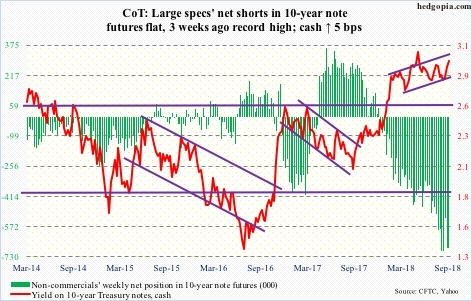
10-year note: Currently net short 682.7k, down 73.
The 10-year Treasury rate (2.99 percent) rose from 2.81 percent on August 22 to Friday’s high of three percent. At least near term, non-commercials have been rewarded for their persistently bearish outlook on 10-year note futures. Net shorts are near all-time highs. The question is, what happens medium- to long-term? Since peaking at 3.12 percent in May, the 10-year has made lower highs, although it is attempting to break out of a four-month channel drawn from that high. The three handle has consistently been viewed by bond vigilantes as a level where it has paid off to go long these notes. This sentiment has to do a 360 before non-commercials possibly make a killing. A lack thereof exposes them to risks of short squeeze in due course.
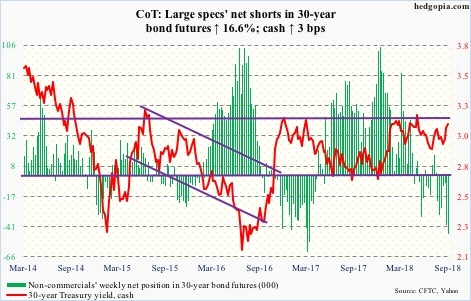
30-year bond: Currently net short 47.1k, up 6.7k.
Major economic releases next week are as follows.
The NAHB housing market index (Sep) and Treasury International Capital data (July) are scheduled for Tuesday.
Builder sentiment in August fell a point month-over-month to 67. Last December’s 74 was the highest since July 1999.
Foreigners have been cutting back on US equities. In the 12 months to June, they bought $30.1 billion worth, versus purchases of $135.7 billion in January.
Wednesday brings August’s housing starts. July inched up 0.9 percent m/m to a seasonally adjusted annual rate of 1.17 million units. January’s 1.33 million was the highest since July 2007.
Existing home sales for August are due out Thursday. July sales were down 0.7 percent m/m to 5.34 million units (SAAR). Last November’s 5.72 million was the highest since February 2007.
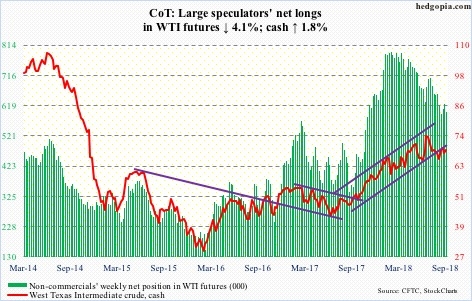
Crude oil: Currently net long 598.1k, down 25.4k.
Spot West Texas Intermediate crude ($68.99/barrel) Wednesday rose to $71.26 intraday, but was unable to hang on to all of the gains, closing at $70.37. It also fell short of last week’s high of $71.40. The EIA report for the week of September 7, which was out in that session, contained several positives, but apparently not enough for traders.
US crude stocks fell 5.3 million barrels to 396.2 million barrels. This was the first sub-400 million number since February 2015. The supply of crude oil is now 22.3 days. Crude imports dropped 123,000 barrels per day to 7.59 million b/d. Crude production decreased 100,000 b/d to 10.9 mb/d. Refinery utilization rose one percentage point to 97.6 percent. Gasoline and distillate stocks, however, rose – up 1.3 million barrels and 6.2 million barrels to 235.9 million barrels and 139.3 million barrels, respectively.
Wednesday’s high also kissed the daily upper Bollinger band. The lower band lies just below the 200-day ($65.55), which was defended mid-August.
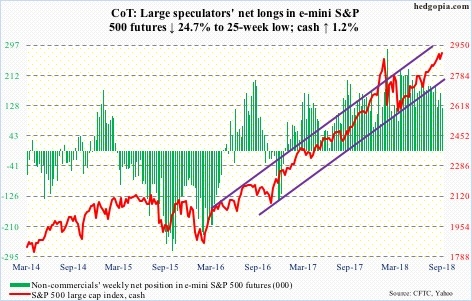
E-mini S&P 500: Currently net long 122.2k, down 40k.
The late-January high of 2872.87 was once again tested Tuesday and it held. The cash (2904.98) is now within spitting distance away from its all-time high of 2916.50. On momentum indicators such as RSI, divergence is developing, but the price is holding its own. This is fine near term, but not healthy medium- to long-term. From the high of August 29 to last Friday’s low, the S&P 500 large cap index shed 1.8 percent, and that was the extent of the latest drop. The Hedgopia Risk Reward Index is very close to dropping into the green zone. Bulls defended the 20-day moving average. Although, at least until Wednesday, flows were not cooperating.
In the week to Wednesday, US-based equity funds (including ETF’s) lost $1.8 billion (courtesy of Lipper.com). In the same week, $4.7 billion came out of SPY (SPDR S&P 500 ETF (NYSE:SPY)) and $247 million out of Vanguard S&P 500 (NYSE:VOO) (Vanguard S&P 500 ETF), even as ishares S&P 500 (NYSE:IVV) (iShares core S&P 500 ETF) gained $85 million (courtesy of ETF.com).
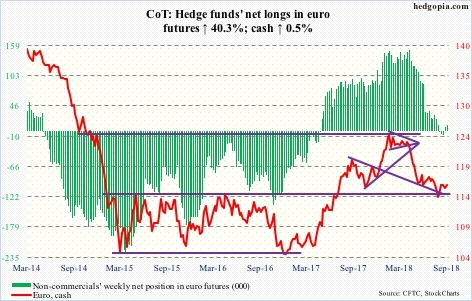
Euro: Currently net long 11.2k, up 3.2k.
The ECB left the deposit rate unchanged at -0.4 percent. No surprise there. It plans to keep interest rates at record low levels at least through next summer. Bond purchases are scheduled to end at the end of the year. No surprise there either. The bank now expects GDP growth of two percent this year and 1.8 percent in 2019, versus prior forecast of 2.1 percent and 1.9 percent respectively. The downward revision was unexpected, but markets were unfazed. The cash ($116.24) rallied 0.5 percent Thursday.
Barring a brief drop to $113.01 mid-August, bulls have defended $115, which has proven to be an important level for nearly four years now. As long as this is intact, they deserve the benefit of the doubt, and need to take out a falling trend line from early June, which was tested this week.
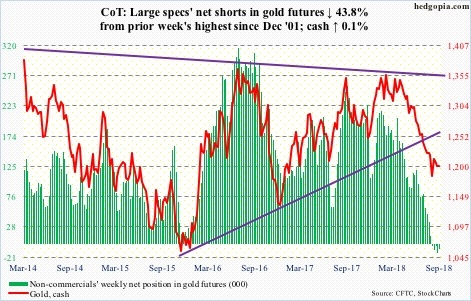
Gold: Currently net short 7.6k, down 5.9k.
Month-to-date, the cash ($1,201.10/ounce) is down 0.5 percent. If it holds up, this will be six consecutive months of decline. This has pushed some monthly momentum indicators into oversold territory. Unwinding of these conditions is natural – either right away or later. In the latter’s case, gold stays oversold, and the price can head lower.
As things stand, since dropping to $1,167.10 mid-August, gold has more or less gone sideways, which should be considered healthy given the rout it sustained since peaking in April. Bulls would have massively increased their odds should they take out support-turned-resistance of $1,213-ish. Thursday, the yellow metal rallied intraday to $1,218 but only to close lower as it got rejected at the 50-day. Consolidation continues.
In the week through Wednesday, GLD (NYSE:GLD) (SPDR gold ETF) lost $57 million. It is a loss but at the same time represents improvement in that the last time weekly outflows were less than $100 million was 14 weeks ago. IAU (iShares gold trust) in the same week gained $12 million.
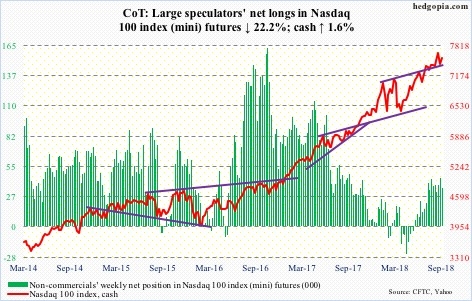
Nasdaq 100 index (mini): Currently net long 34.7k, down 9.9k.
After three weeks of inflows totaling $2 billion, QQQ (Invesco QQQ Trust) lost $1.3 billion in the week ended Wednesday (courtesy of ETF.com). But this was before Thursday’s one-percent rally, which saw the cash (7545.50) recapture shorter-term averages.
Last week, the Nasdaq 100 defended the 50-day as well as a rising trend line from early April. This continued this week, before pushing past 7500 Thursday. Two weeks ago when the index peaked at 7691.10 it was rejected at seven-month channel resistance. The upper bound currently extends to 7750, which is what longs are probably eyeing near term.
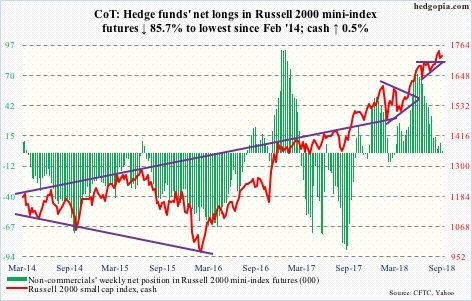
Russell 2000 mini-index: Currently net long 1.2k, down 7.2k.
After $182 million in combined outflows in the week through Wednesday last week, IWM (iShares Russell 2000 ETF) and IJR (iShares core S&P small-cap ETF) this week took in $219 million (courtesy of ETF.com). This helped bulls once again defend a rising trend line from early February. This level also represents retest of a breakout on the cash (1721.72) from 18 sessions ago. This is all good, but the Russell 2000 small cap index this week underperformed versus its major US indices. It was only up 0.5 percent for the week. End-August short interest on IWM was at a five-month low, so there is not much squeeze fuel left. Bulls cannot afford to lose the aforementioned support.
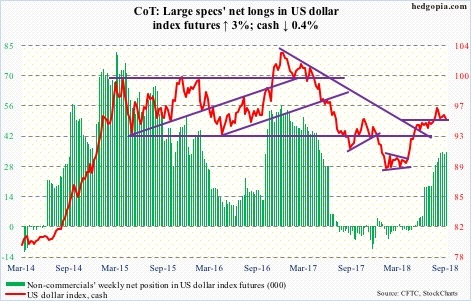
US Dollar Index: Currently net long 34.5k, up 1k.
Dollar bulls are struggling to save support at 95-plus on the cash (94.93). On the weekly chart, a potentially bearish MACD cross-under is on the verge of completing. In six months between February and August, the US dollar index rallied 9.9 percent. It is probably time to digest those gains – either through time or price.
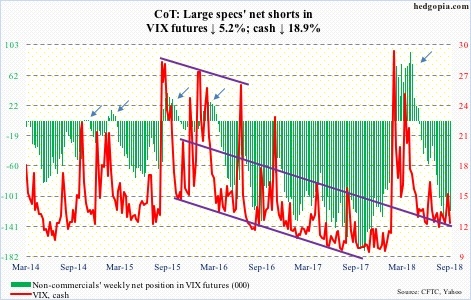
VIX: Currently net short 120.4k, down 6.7k.
The cash (12.07) managed to stay north of the 200-day just one day, which was last Friday. This week, VIX fell in all five sessions, with a loss of the 50-day Thursday. The daily lower Bollinger band, which is slightly dropping, lies at 11.31. Several times in the past, a test of this band is followed by quick rallies/spikes, but only to soon reverse. Since VIX shot up intraday to 50.30 on February 6, it has persistently made lower highs. For consolation, volatility bulls can point to the fact that in the past five months VIX in general has found support at 11-plus.
In the meantime, the 21-day moving average of the CBOE equity-only put-to-call ratio (0.596) fell in all five sessions this week, earlier having peaked at 0.617 Friday last week. In the right circumstances for equity bulls near term, this can continue dropping. For reference, the ratio bottomed at 0.543 on January 26, when the S&P 500, and several other major US indices, peaked before a quick, double-digit, two-week drop.
Thanks for reading!

