Tax-cut infused earnings have been solid. The rapid-fire rise of longer-term borrowing costs has slowed considerably. And corporate share buybacks have dwarfed earlier records.
In Q2 alone, corporations purchased a staggering $436.6 billion in stock buybacks. That brings the year-to-date total to $670 billion. Similarly, announced S&P 500 buybacks are practically leaping off of the chart.
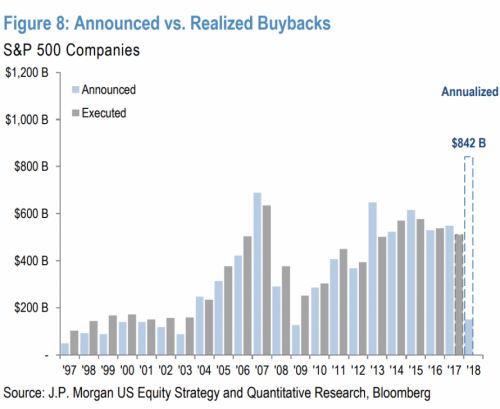
More than most factors influencing market direction, buybacks have kept large-cap stocks from succumbing to legitimate concerns about Federal Reserve policy error, China trade tensions or valuation extremes. Buyback activity improves earnings per share (EPS) comparisons since there are fewer shares in existence. Moreover, the investment community is ultimately vying for a reduced supply of available stock.
There is some irony in the buyback phenomenon. The practice appeared as though it might roll over as rising rates would make it difficult for corporations to continue borrowing in the debt markets to finance stock acquisitions.
Then came the corporate tax cuts. And companies realized they’d need to do something will the extra cash. For the most part, the extra cash is going directly into stock repurchasing programs.
However, investment researchers at TrimTabs recently discovered a trend that is not necessarily sitting well with market watchers. In particular, executive insiders have been selling their stock at an exceptionally fast pace.
For example, TrimTabs determined that corporate insiders unloaded $8.4 billion in stock shares in May and $9.2 billion in June. It represented the largest two-month share dump in a year.
In June alone, insiders sold $8 in stock for every $1 that they purchased. Along those lines, there has been a noteworthy spike in the Insider Transactions Ratio. Readings above 20 are supposed to be near-term bearish for equities. The most recent reading? 58.
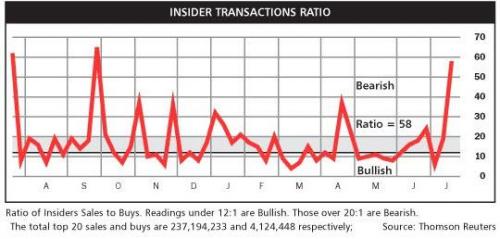
Truth be told, the Insiders Transactions Ratio has had limited success as a sentiment indicator. Indeed, executive insiders themselves do not have an incredible track record at timing the buying and selling of their own stock.
Nevertheless, the Securities and Exchange and Commission (SEC) is beginning to take notice. Commissioner Robert Jackson said during a speech in June, “Right after the company tells the market that the stock is cheap [via announcing buybacks], executives overwhelmingly decide it’s time to sell.”
In a nutshell, the SEC’s own analysis revealed that corporate insiders have been selling a lot more shares after releasing buyback news than before the news. While there’s nothing illegal about taking advantage of post-press-release price bumps, the regulator may seek to curb the “abusive” practice in the near future.
It might be interesting to think of executive insider selling in this way. Warren Buffett recently announced changes in his company’s rules regarding when and how Berkshire Hathaway (NYSE:BRKa) might engage in stock buybacks. Shares jumped 5% for their single largest one-day gain in roughly seven years.
Now imagine if the Oracle of Omaha sold tens of millions of dollars in Berkshire Hathaway B (NYSE:BRKb) shares after the announcement, just as others in the investing world were buying on the news. It wouldn’t be illegal for him to do so.
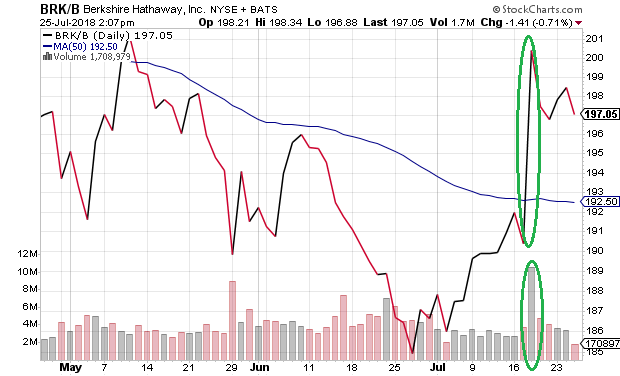
I seriously doubt Warren Buffett would ever jeopardize his reputation as a national icon. On the flip side, it is becoming increasingly evident that Buffett is uneasy; he is restless, sitting on $100 billion plus in cash equivalents.
The problem for a value maven? There’s not enough value in the market itself. And for Buffett, loosening the reins to reacquire shares of his own company may be the only prudent thing to do with Berkshire’s cash stash.
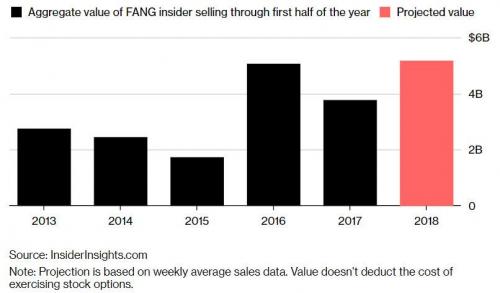
Unfortunately, unlike Buffett, insiders at the “techie” corporations with the biggest market capitalization are selling out. Indeed, the process is self-reinforcing. More and more capital is flowing into exchange-trade index funds (ETFs) and index mutual funds. Buybacks reduce the supply of available shares, particularly shares of the FAANG club (Facebook (NASDAQ:FB), Apple (NASDAQ:AAPL) Amazon (NASDAQ:AMZN), Netflix (NASDAQ:NFLX), Alphabet (NASDAQ:GOOGL) Inc Class C (NASDAQ:GOOG)). Yet the index trackers must pursue ownership of the dwindling supply of FAANG shares, driving prices higher, irrespective of valuation.
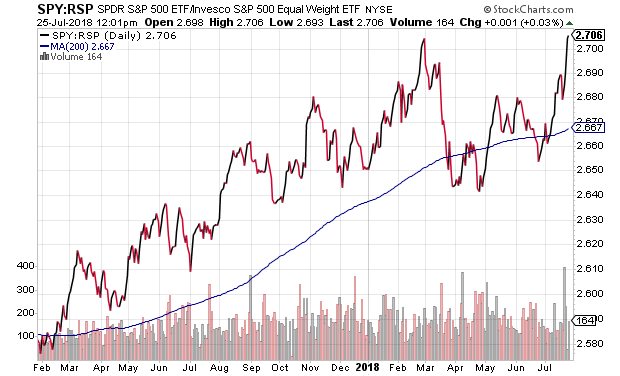
In fact, the market-cap madness is easy to visualize. A broader based bull market would see Invesco S&P 500 Equal Weight (ETF) performing as well, if not significantly better than the S&P 500 SPDR Trust (SPY (NYSE:SPY)). This is not the case, though. The SPY:RSP price ratio is hitting record peaks because FAANG stocks are heavily weighted in SPY.
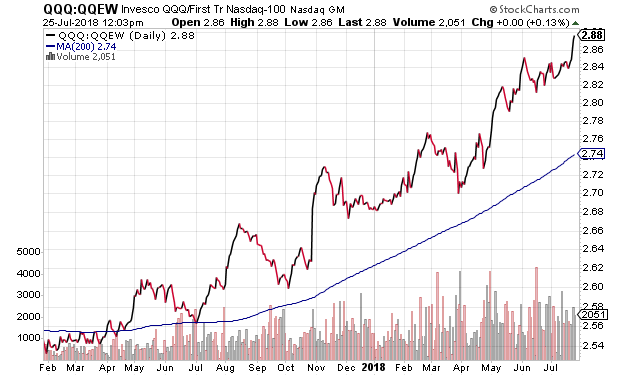
The success of the privileged few FAANG components is even more prevalent in the NASDAQ 100 index. A broader based NASDAQ bull would witness First Trust NASDAQ-100 Equal Weighted (NASDAQ:QQEW) performing as well, if not significantly better than Invesco NASDAQ 100 QQQ (QQQ). Instead, The QQQ:QQEW price ratio is hitting new highs on FAANG euphoria.
Does it matter if bull markets are narrow or broad-based? I think so. For instance, Wall Street’s top analysts have more than 180 buys on FAANG and a modest 7 sells. That kind of discrepancy is eerily reminiscent of the dot-com craziness in 2000.
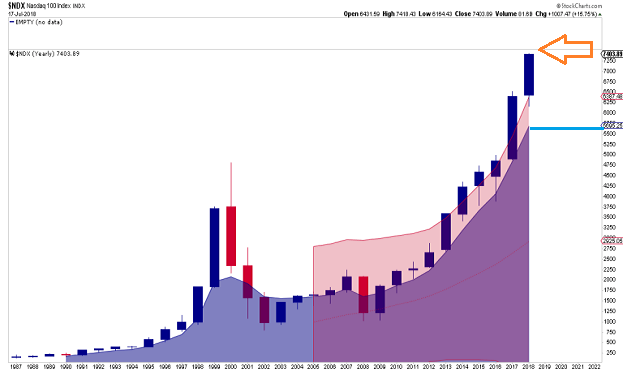
Similarly, when I review technical charts of the Nasdaq 100, and see that the current price is 30%-plus above its yearly 5 exponential moving average (5 EMA), I wonder when the price reconnect will occur. Throughout history, price reconnects always occur.
The biggest danger may be in the notion that FAANG dominance is a good thing for indexers. After all, most ETFs are market-cap weighted, not equal weighted. It follows that investors keep winning as long as FAANG keeps on winning.
Unfortunately, neither ultra-low borrowing costs nor the one-shot tax bonanza will be able to finance these kind of buyback levels down the road. Worse yet, should there be a populist backlash against corporate greed and questionably timed insider selling, FAANG stocks (and the ETFs that overweight them) may get beaten to smithereens.
Can’t see the forest for the trees? Consider data showing that Amazon paid only 12.9% of profits to federal, state, local and foreign taxes from 2007 through 2015. According to S&P Global Market Intelligence, that’s only half what the average S&P 500 company paid in the same time frame.
Equal weighting and diversification may not have been an investor’s best friend over the course of the current business cycle. They may become worthwhile acquaintances in the months and year ahead.
Disclosure Statement: ETF Expert is a web log (“blog”) that makes the world of ETFs easier to understand. Gary Gordon, MS, CFP is the president of Pacific Park Financial, Inc., a Registered Investment Adviser with the SEC. Gary Gordon, Pacific Park Financial, Inc., and/or its clients may hold positions in the ETFs, mutual funds, and/or any investment asset mentioned above. The commentary does not constitute individualized investment advice. The opinions offered herein are not personalized recommendations to buy, sell or hold securities. At times, issuers of exchange-traded products compensate Pacific Park Financial, Inc. or its subsidiaries for advertising at the ETF Expert website. ETF Expert content is created independently of any advertising relationship.
