5 Trade ideas excerpted from the detailed analysis and plan for premium subscribers:
CME Group Inc (NASDAQ:CME)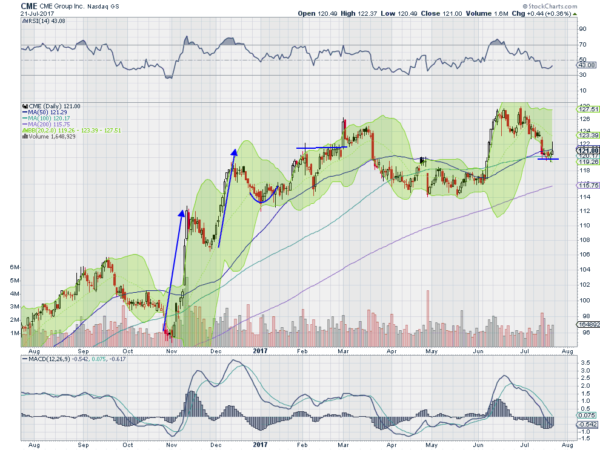
CME, $CME, ran higher after the November election, but then met resistance in December. Since then it has moved mainly sideways in a broad range. Three weeks ago it made a possible double top and started back lower. But that stalled short of confirming the top and has settled sideways. If it holds this would be a higher low after a higher high, an uptrend. The RSI is turning back up and remains in the bullish zone with the MACD leveling in its fall. Look for a push up off of support to participate…..
Fifth Third Bancorp (NASDAQ:FITB)
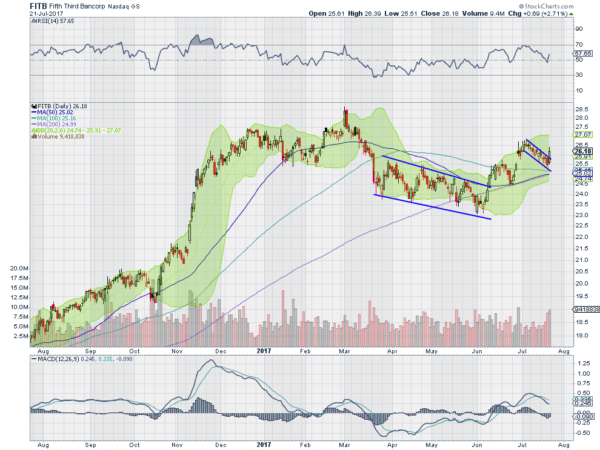
Fifth Third, $FITB, pulled back slightly into the election and then exploded to the upside. That move slowed in December and stalled into the New Year. It started pulling back kin March and crossed its 200 day SMA in May, bottoming in June. Since then it has been trending higher. Last week it ended a retrenchment in the uptrend Friday with a push higher. The RSI turned up as well but the MACD is still falling. Look for continuation to participate higher…..
Great Plains Energy Inc (NYSE:GXP)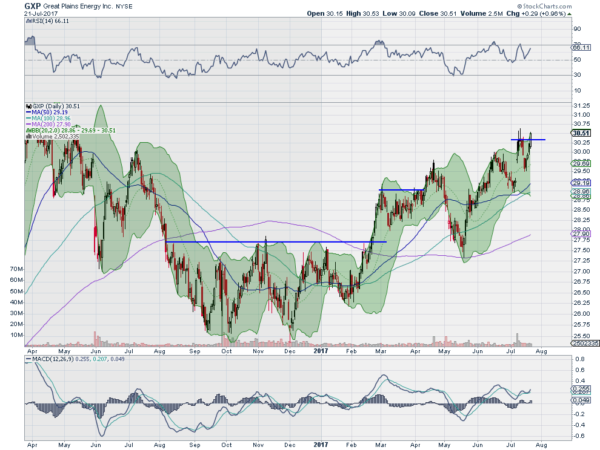
Great Plains Energy, $GXP, went through a bottoming process from August to February. As it rounded out of that it made a higher high and then came back to retest the 200 day SMA in May. Another higher high and then a retest at the 50 day SMA sees it moving higher again. Friday it pushed into new high territory again. It has support for more upside from a rising and bullish RSI and a MACD that is also rising. Look for continuation to participate higher…..
Jazz Pharmaceuticals PLC (NASDAQ:JAZZ)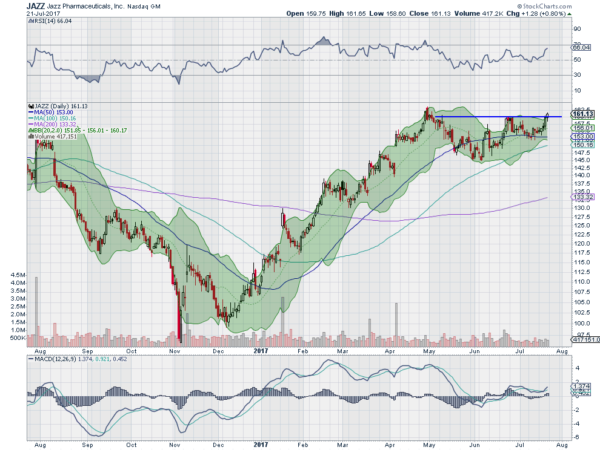
Jazz Pharmaceuticals, $JAZZ, had a solid run higher from November through to a peak at the end of April. Since then it pulled back over May and bottomed at the beginning of June. Rounding up it is now back approaching the April high. The RSI is bullish and rising while the MACD is crossed up and rising. Look for continuation to participate higher…..
Oshkosh Corporation (NYSE:OSK)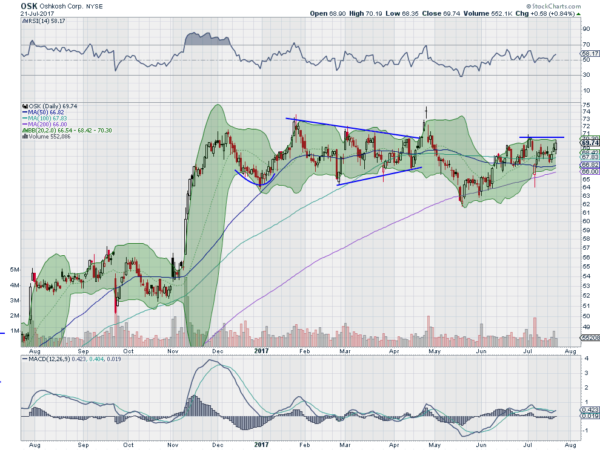
Oshkosh, $OSK, drove higher quickly after the election. It settled almost as fast into a sideways consolidation and stuck there through April. The last two months saw tightening consolidation and then a pop out of a symmetrical triangle that failed to the upside after 2 days. That reversed lower to the 200 day SMA and it found support. The bounce stalled at the beginning of July and then pulled back to the 200 day SMA before rebounding again. Now it is at resistance with a rising and bullish RSI and MACD crossed up. Look for a push over resistance to participate higher…..
After reviewing over 1,000 charts, I have found some good setups for the week. These were selected and should be viewed in the context of the broad Market Macro picture reviewed Friday which with July Options Expiry and 1 full week of earnings behind them, sees the Index ETF’s looking strong and ready to move higher.
Elsewhere look for Gold to continue in its uptrend while Crude Oil pulls back lower in the short run within the longer term drift higher. The US Dollar Index continues to weaken and move lower while US Treasuries strengthen and move higher. The Shanghai Composite continues to drift up while Emerging Markets move higher with strength.
Volatility looks to remain at extremely low levels keeping the bias higher for the equity index ETF’s SPDR S&P 500 (NYSE:SPY), iShares Russell 2000 (NYSE:IWM) and PowerShares QQQ Trust Series 1 (NASDAQ:QQQ). In the short run their charts look to consolidate or pullback but all look strong and ready to continue higher in the longer timeframe. Use this information as you prepare for the coming week and trad’em well.
DISCLAIMER: The information in this blog post represents my own opinions and does not contain a recommendation for any particular security or investment. I or my affiliates may hold positions or other interests in securities mentioned in the Blog, please see my Disclaimer page for my full disclaimer.
