From Mike Burnick: Our E-Wave cycle forecast model has been steadfastly calling for a stock market correction, and perhaps a sharp one.
In fact, stocks are overdue for a pullback.
And now I’m seeing fundamental confirmation that a correction is dead ahead, and it’s from an unlikely indicator: China’s deleveraging.
Recently, I wrote about China’s runaway debt binge. And I noted how Beijing has reined in credit growth while it cracks down on China’s “shadow banking” system. Well it’s working, which is good for the long-run health of China’s economy, but bad for global stocks.
Shadow Banking
First the facts. Shadow-banking assets in China surged 21% last year alone to the equivalent of $9.3 trillion, equal to 87% of China’s entire economy.
There’s no question that such fast-paced growth in credit – much of it loosely regulated at best – represents a clear and present danger to China’s economy.
So about nine months ago the authorities in Beijing began cracking down on excess credit growth by gradually raising short-term lending rates. And it’s paying off.
In April, total credit growth slowed to 14.4% year-over-year, down from 16.6% a year ago.
Although the Red Dragon’s economy has slowed a bit as a result, its growth still stirs envy in the rest of the world, clocking in at 6.9% last quarter, with retail sales “slowing” to 10.7% year-over-year and corporate-profit growth of “just” 24% in March.
But here’s why China’s credit slowdown spells trouble for global stocks:
 |
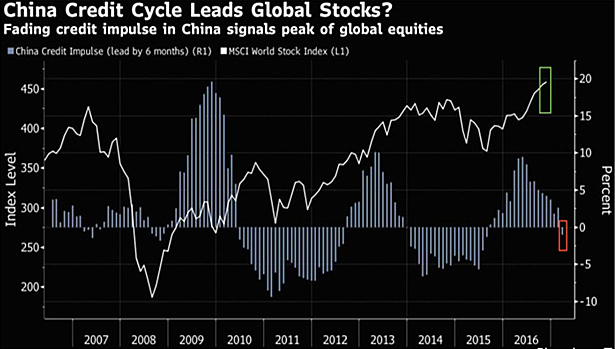
As you can see in the chart above, credit growth in China has a very tight correlation with the health of global stocks. When China’s credit growth turns negative, stocks tend to struggle.
In the past, we’ve seen steep market corrections lining up perfectly with periods of negative credit growth in China – most notably in the 2008 bear market, again in 2011 and again in 2015. Well guess what?
China’s credit growth just turned negative again for the first time since early 2014. And the last time this happened, the Dow dropped 8.5% in mid 2014, then suffered back-to-back corrections of 16% and 14% in 2015 and early 2016.
So far, stocks have been defying gravity – as well as my own expectations for a correction – by notching new record highs recently, led mainly by the tech-heavy Nasdaq 100.
The S&P 500 got in on the action this week by hitting a new record high above 2,400 for the first time. Even the small-cap Russell 2000 scaled a new peak.
But mark my words, this rally is running on fumes and a sharp correction could begin at any time. China’s credit growth turning negative could be just the catalyst to trigger this sell-off at long last.
The SPDR S&P 500 ETF Trust (NYSE:SPY) fell $1.21 (-0.50%) in premarket trading Wednesday. Year-to-date, SPY has gained 7.40%, versus a % rise in the benchmark S&P 500 index during the same period.
SPY currently has an ETF Daily News SMART Grade of A (Strong Buy), and is ranked #1 of 108 ETFs in the Large Cap Blend ETFs category.
