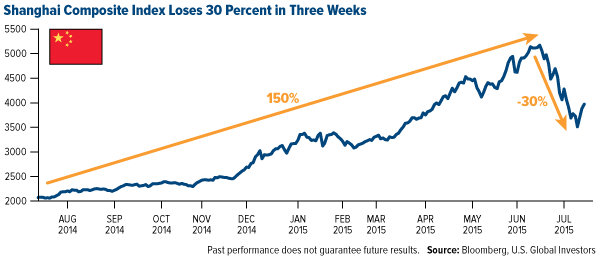
The sheer size and importance of China’s equity markets cannot be overstated. Second in size only to the NYSE, the combined value of the Asian country’s stock markets is $14 trillion and change. Or at least it was, before they fell 30 percent, wiping away nearly $2 trillion in value. To put this in perspective, the gross domestic product (GDP) of debt-troubled Greece is around $200 billion.

So how did this happen? The answer has a lot to do with the quantity and quality of investors.
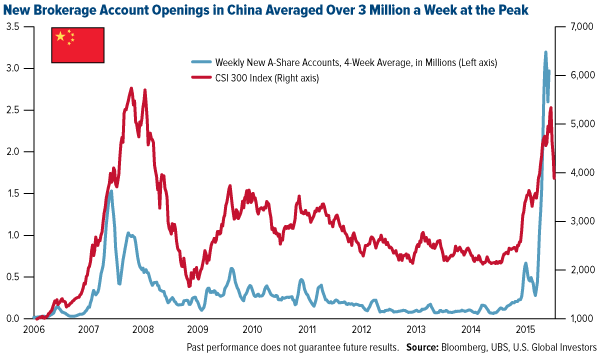
In most major economies, stock markets trading is dominated by professional money managers. But in China, between 80 and 90 percent of the domestic A-share market is made up of retail investors, many of them novices who sought to participate in the yearlong bull run. An eye-popping 40 million new brokerage accounts were created in the one-year period ended in May. The Communist Party, by comparison, gained only a little over one million new members in the same period. At the peak, accounts were being added at a rate of over three million per week.
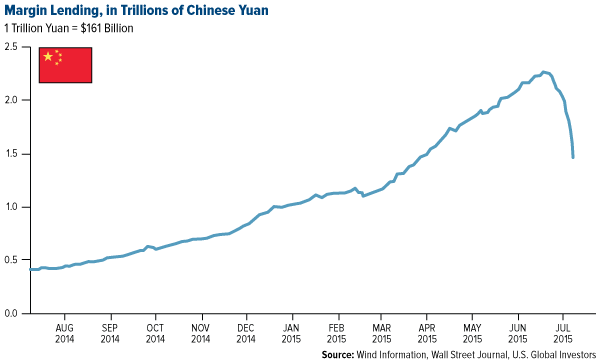
For many of these first-time or relatively inexperienced investors, the price of entry was margin lending. Cosmic amounts of it. Near the end of June, 2.08 trillion yuan ($335 billion) worth of borrowed funds flooded the Shanghai Composite and Shenzhen markets. Margin lending as a percentage of total market cap rose to as high as 20 percent. In the U.S., it’s about 2.5 percent.
This combination—millions of new accounts mixed with unprecedented leveraging—greatly contributed to the selloff. As you can see above, this leverage is now unraveling as investors are forced to sell in order to meet margin calls.
Beijing has responded with a host of measures to prevent the market from sliding any further, one of the most significant being a ban on huge institutional shareholders from selling until the Shanghai Composite rises above 4500. As of this writing, it’s just above 3800 after breaking a three-day rally.
The good news is that some analysts believe the worst might be behind us. Financial services firm UBS takes the position that, as massive as the correction was, it shouldn’t have a “major” economic impact.
In the meantime, we have raised the cash level in our China Region Fund (USCOX) and are ready to deploy it when the right opportunity arises.
Foreign and emerging market investing involves special risks such as currency fluctuation and less public disclosure, as well as economic and political risk. By investing in a specific geographic region, a regional fund’s returns and share price may be more volatile than those of a less concentrated portfolio.
The Shanghai Composite Index (SSE (LONDON:SSE)) is an index of all stocks that trade on the Shanghai Stock Exchange. The CSI300 is a capitalization-weighted stock market index designed to replicate the performance of 300 A-share stocks traded in the Shanghai and Shenzhen stock exchanges.
All opinions expressed and data provided are subject to change without notice. Some of these opinions may not be appropriate to every investor.


