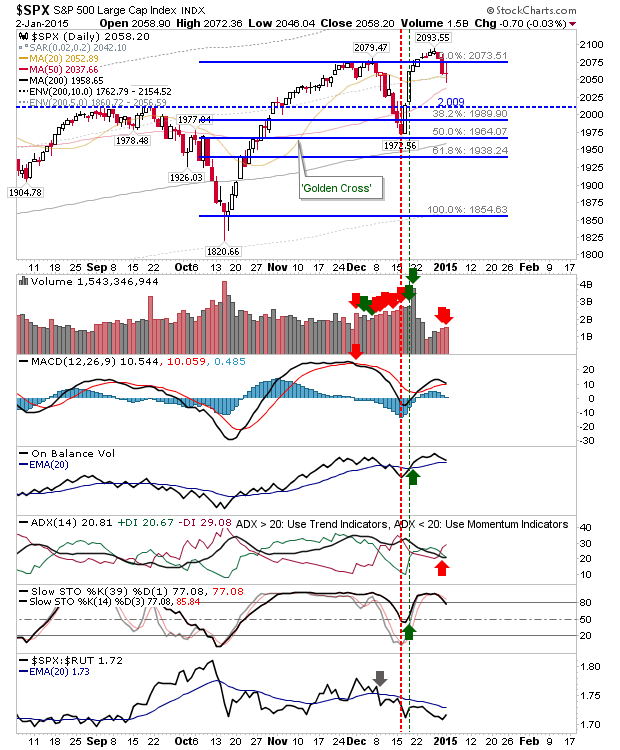
Another year rolls in as the secular bull market continues its march. We have seen some modest selling, although there has been little in the way of volume to back it up. The S&P 500 is sitting on its 20-day MA having closed Friday on an indecisive 'spinning top' doji.
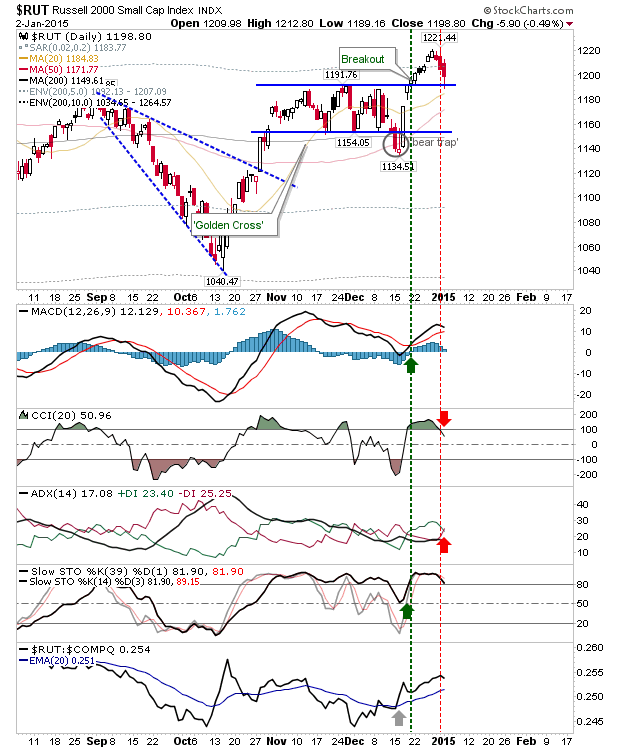
The index to watch for 2015 is the Russell 2000. It did very little in 2014, but it looks to be mustering for a move higher. The 2009 to present day rally may feel long in the tooth, but if Small Caps get their game on, then more upside is likely to follow all around.
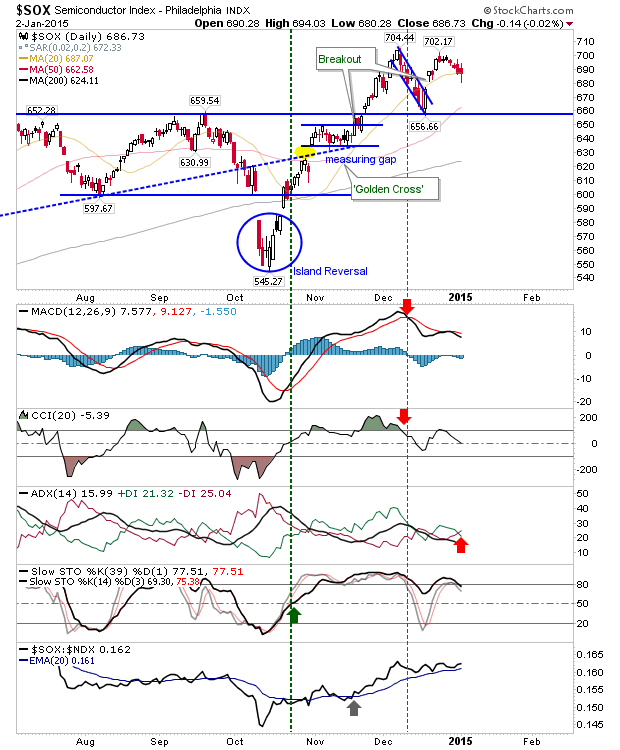
I'll also be keeping an eye on the Semiconductor Index for 2015. This is a good measure of economic health, and along with the NASDAQ 100 forms its own 'Dow Theory' (at least in my eyes). It's currently shaping a consolidation between 705 and 660.
I have no predictions for the year - nobody knows what will happen. Low oil prices will be good for someone, although holders of energy stocks may not feel it. I'm already long Kinder Morgan (NYSE:KMI) in the Energy sector, although this sector is still seeking a bottom, and given the October 'death cross' it may spend most of 2015 trying to find one. If markets were to sell off in Q1, then things could get even uglier for Energy - but I'm happy with my position.
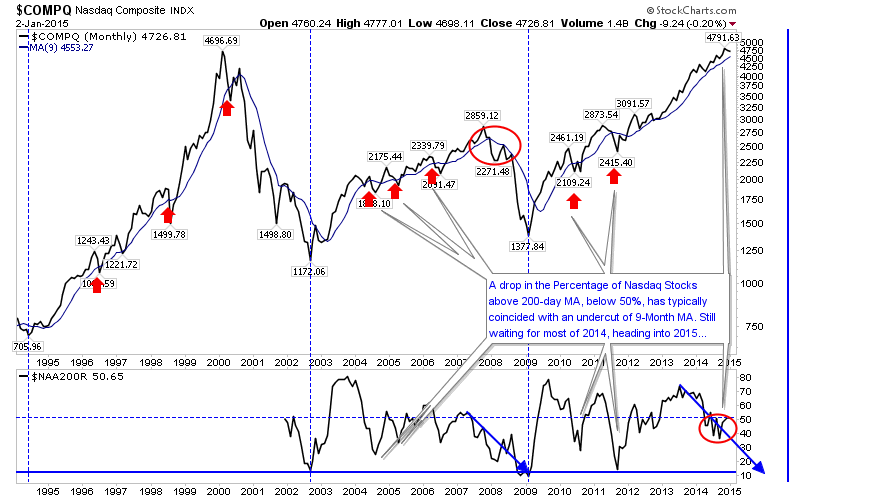
If there was a chart for the New Year, then this would be my choice. The Nasdaq has enjoyed a stellar advance since the March 2009 low, but for 2014 the majority of its components have struggled to hold above their 200-day MA; fewer stocks maintaining a rally is not good news. Prior struggles have seen an undercut of a 9-month MA, but the most recent dip has yet to see a challenge of this MA (currently at 4,553).
Also missing is the big sell off which happens when the subsequent bounce, after the undercut of the 9-month MA, fails to regain the MA. This is a monthly chart, so the whole process could take 6 to12 months to develop after the initial break, but this is a chart I will be watching for this year.
