by Pinchas Cohen
For the first time since the 2008 financial crisis, all the big banks passed the Federal Reserve’s annual stress test, the measure of their financial health. This boost to banks couldn’t come at a better time, as financial shares take off, part of a sector rotation on the prospect of higher interest rates.
When economic growth expectations rise, the market's financial sector tends to perform well, making it a leading indicator for profit-seeking investors who want to stay ahead of the curve prior to actual evidence of the fact. That's because primary income for financial sector companies comes from interest. As well, the borrowing capacity of corporations and individuals improves.
Financials Flat For Most of 2016
The S&P 500 Financial Index was flat for almost all of 2016. At first, China’s economic slowdown raised concerns on global growth; later, in June, uncertainties surrounding global trade flows brought about by the Brexit vote added to the pessimistic outlook for financials.
However, after The US election—from November 11 till March 1 of this year—the index broke out of its congestion and rose by a whopping 25% in less than 4 months, leading the stock market rally. The first 18.5-percent leg up of the rally, till December 9, was fueled by revived animal spirits, attributed to Trump’s reflation trade, specifically regulation rollback and his reflationary trillion-dollar spending plans, both of which would have profited financials the most.
Whether in response to Trump reflation and its agenda, or irrespective of it according to some, on December 14, the Fed announced a 25 basis-point hike to the Fed funds rate, to 0.5-0.7 percent. In addition they signaled that three more rate hikes were on the agenda in 2017. The Fed’s confidence in the growth of the world’s largest economy is what was behind the second rally, which ended on March 1st.
Citi Gets the Gold
Yesterday, we discussed the expectation of a stock leadership rotation, out of tech shares and into financials, at the start of an anticipated reflating economy.
Yesterday, after the Fed gave all 34 US financial firms tested a clean bill of health and approved their capital return plans, Citigroup (NYSE:C) and JPMorgan (NYSE:JPM) announced their biggest share buybacks ever. Citi also doubled its dividend to 32 cents.
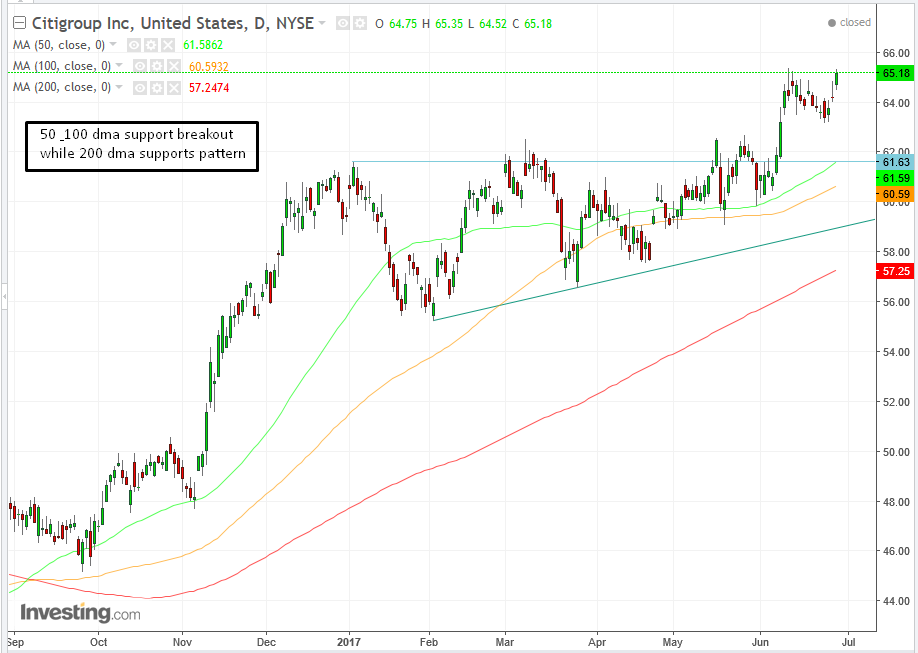
Citigroup, in fact, aced all the Fed's metrics with flying colors. It led the big banks on crucial capital ratios, coming out in first place overall. Still, Citi’s stock remains cheap. It closed yesterday at $65.18 and is trading below book value, at 0.878

Since the beginning of the year, Citi has been trading within an Ascending Triangle pattern. The dynamics of a pattern with a rising bottom and a flat top demonstrates that buyers are way more eager than sellers.
While buyers are committed to buying at escalating prices, starting with $55 in early February, then $56 in late March, followed by $58 in late April, to $60 in mid-May and early June, sellers were only willing to trade at the $61-2 level. Buyers’ willingness to acquire shares at ever rising prices is tantamount to soldiers advancing on the battle field, gaining ground with each higher demand until finally buyers overrun sellers, at which point there are no longer any sellers left—only buyers. Then, the price breaks out like a released wound up coil spring.
Citi's price cleared the $62 area and reached $65.30, almost 6-percent higher, in just three trading sessions, after churning for half a year.
The share price corrected between June 12 and 23 to $63.30, and in the last three trading sessions returned to the resistance of the first leg up out of the consolidation pattern.
Price Target And Trading Strategies
By the size of the pattern, the target implication is roughly $6, or 10% from its breakout, to about $68.
Conservative traders – bargain hunters – would wait for a lower-probability second complete return move, to test the pattern’s support at the $62 price level before going long. Depending on their frugality, they would wait to at least retest the pull-back’s support above $63, before going long for the $6 profit implications. The real bargain hunters would wait for the lesser probability of a complete return move to retest the pattern’s support at the $62 level.
Moderate traders would be happy with the more likely retesting of the breakout’s pullback to $63.25.
Aggressive traders who are raring to go would jump in now, on fears of missing the second leg of the breakout after the consolidation since June 12, in which fresh investors are expected to have come in to carry the load for the next rally.
However, aggressive doesn’t have to mean careless. Unless these traders are going for the full target and are therefore willing to place a stop loss beneath the $63 pullback at the very least (if not beneath the $61 pattern top) this trade could go from being aggressive to being outright gambling.
