by Pinchas Cohen

In today's Opening Bell, we made the point that iron ore's current fall is not only bad for its major supplier, Australia, but since the falling price signals decrease demand, it's also bad for its biggest consumer, China. That's because it could suggest the Chinese economy is contracting. This may be confirmed by a recent soft-patch in the Chinese economy, if it continues.
It’s difficult to say with certainty which factors actually effect assets. Indeed, it may be almost impossible, since price is the sum total of what an asset is worth to all interested parties at any given time. This is especially true in a global economy, where every market, each asset class and every individual asset is intertwined with elegant complexity. But that also makes it more difficult sometimes to pinpoint specific reasons for a surge or a plunge.
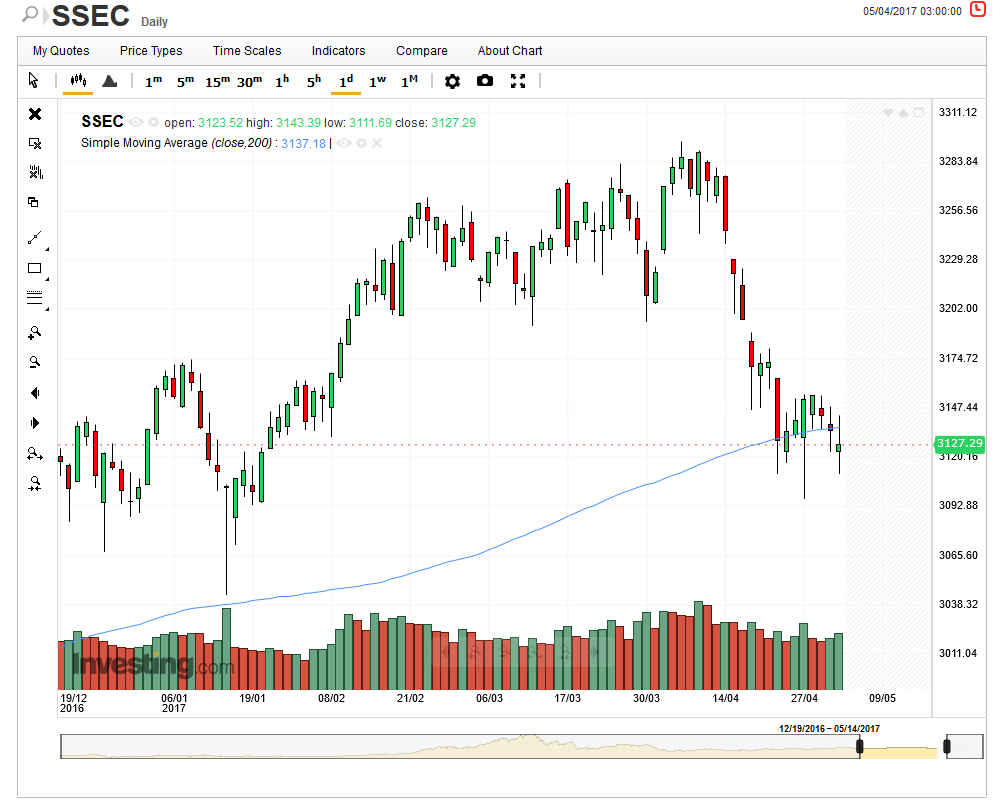
The narrative thus far for the Shanghai Composite has been that it has rapidly fallen 5% from its April highs on Chinese governmental efforts at tightening financial regulations—echoing a current heated topic in the US—and has been “assisted” by a recent soft patch Chinese in economic data. However, perhaps iron ore's falling price is an expression of dampening global demand and not just that of the world’s greatest metal consumer, China.
Today, the Shanghai Composite fell below its 200dma, for the first time since the end of September 2016. A new uptrend in the index started during mid-2014, but only successfully made it above the 200dma during October of that year. Since then the index has soared, up 120% from 2,300 to 5,200 over the course of just 11 months, from July 2014 to June 2015.
At that point it fell. From the time it crossed below the 200dma on September 2015 at 3,600, it dropped 1,000 points in just four months, through January 2016.
Finally, at the beginning of October 2016 it crossed back above the 200dma and climbed 8% to 3,300 in just two months, through the end of November.
Now it has crossed below again, for the first time since October. It would appear the fluctuations are accelerating.
However, on April 27, the index formed a hammer, a bullish candlestick. Since then, it has been holding support. Only a decisive close below 3,100 would signal a further decline.
Momentum indicators are oversold, which suggests an upward correction is in order. However, keep a close eye out for a downside breakdown of 3,100.
This would signal there's another meaningful move down coming. And of course, if Chinese economic data continues to disappoint, that too would be a clear indicator that there's another downleg ahead for the Shanghai Composite.
