There appears to be a puzzling contradiction between market narrative and actual market action. Headlines insisted that the trade dispute poses the biggest risk to equities, but small-cap stocks continued to outperform and mega-cap shares to lag—even when reports suggested an expedient trade resolution was on its way.
However, if higher tariffs were what made investors nervous, then market structure has been upside down. The growth of multinational companies has indeed been at risk, as they rely on exports. Domestic firms, though, have mostly yet to saturate the U.S. market.
We have been speculating the real story is linked with the strengthening dollar, as small caps outperformed amid both the ups and downs of trade talks.

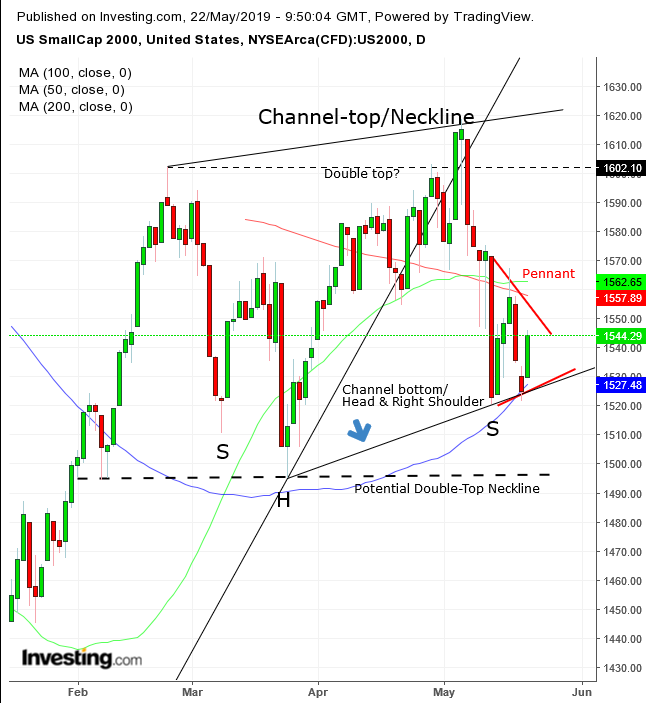
The Russell 2000 is up 14.5% YTD, while the Dow lags at 11%, faring as the worst performing major U.S. average this year. The Russell 2000 is trading in a H&S continuation pattern, whose upside breakout will likely catapult prices higher yet.
The golden cross this month—when the 50 DMA crossed over the 200 DMA for the first time since triggering a death cross during the December rout—reinforces the outlook for a continued uptrend.
Note of Caution: the bullish pattern is complete only upon an upside breakout, past the 1,630—per the current angle of the neckline, 5% higher than the current price. For now, while the price found support at the 50 DMA, it is trapped within a pennant formation as bulls and bears appear evenly matched, but the upper boundary of the formation is guarded by the 200 DMA, opening a scenario for the drop from earlier in the month to resume, with a downside breakout.
If that occurs, it would also break the bottom of an ascending channel, and potentially turn the trading range since Feb. 25 into a double top, if prices fall below the March 25 low, increasing the likelihood of a fallout with disappointed bulls.
Trading Strategies
Conservative traders should wait for an upside breakout to complete the H&S continuation pattern. The neckline is upsloping, which forces the price to chase after it for a valid penetration. Cautious traders would employ a minimum 3% and 3-day filter—preferably to include a weekend close—to avoid a bull trap. Then, they’d wait for a return move to retest the neckline’s integrity, with at least a single long green candle engulfing a red or small candle of either color.
Moderate traders may brave a long position with a close above the 200 DMA, plus whatever filter fits their risk aversion, to reduce the odds of getting whipsawed.
Aggressive traders may go long now , or wait for weakness to buy on the dip and closer to the channel’s support, counting on the bottom of the ascending channel to support prices back toward the neckline.
Trade Sample
- Entry: 1,520
- Stop-Loss: 1,490, below the March 25 low, the Head of the H&S.
- Risk: 30 points
- Target: 1,610, below the top of the ascending channel/H&S neckline
- Risk-Reward Ratio: 1:3
