Gold’s safe haven sparkle tends to make it the center of attention among the precious metals, but sometimes the paler silver can conceal untold potential.
Silver has dominated the headlines this week, having risen by 13% in just three trading days to its highest in over seven years, trading around $22 an ounce. The price is on track for its third-biggest weekly gain in a decade.
Unprecedented stimulus has depreciated the value of fiat money, increasing that of precious metals. Gold has gained 20% so far in 2020, while silver has risen by 45%, outpacing both the NASDAQ, which is up 17% and the S&P 500, which is flat. However, unlike gold, silver also benefits greatly from industrial demand. It is widely utilized in the electrical and electronics sector, used, for example, in solar panels—benefitting from the global "green" initiative—and in 5G components.
Also, while gold is approaching record-highs—always a point of technical contention—silver is still a whopping 115% away from its all-time peak at $49.95 per ounce, struck in early 1980, when the billionaire Hunt brothers were cornering the market. This puts silver in a much better position than its better-know golden counterpart for a rally.
Trading silver versus gold affords a hedge against the return of risk-on sentiment, as both precious metals will retain their respective values against each other when stocks rally.
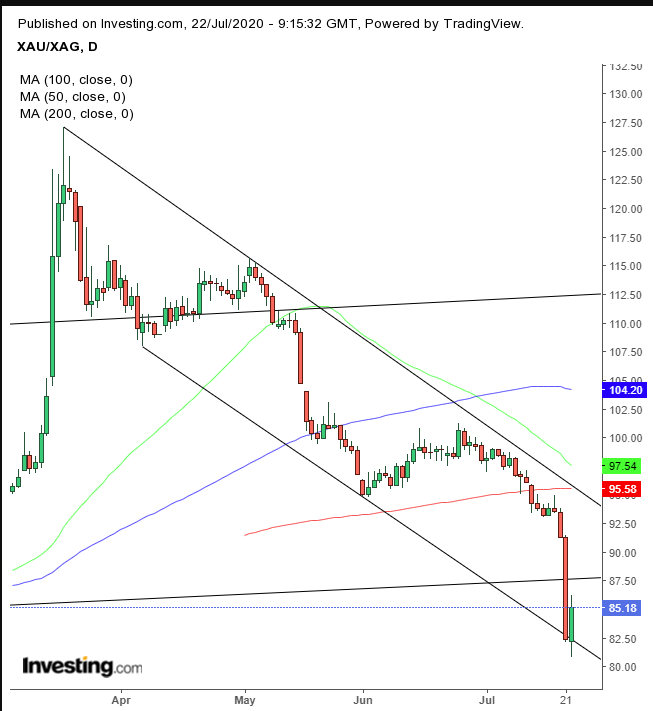
The following chart shows the ratio between gold and silver, derived by dividing the price of the former, by the price of the latter.

Silver has almost doubled in value since the March lows, while gold has risen by just 28%. This has created a falling channel for the gold/silver ratio. The ratio itself has fallen below its 200-DMA and its 50-DMA is about to do the same, creating the dreaded "death cross."
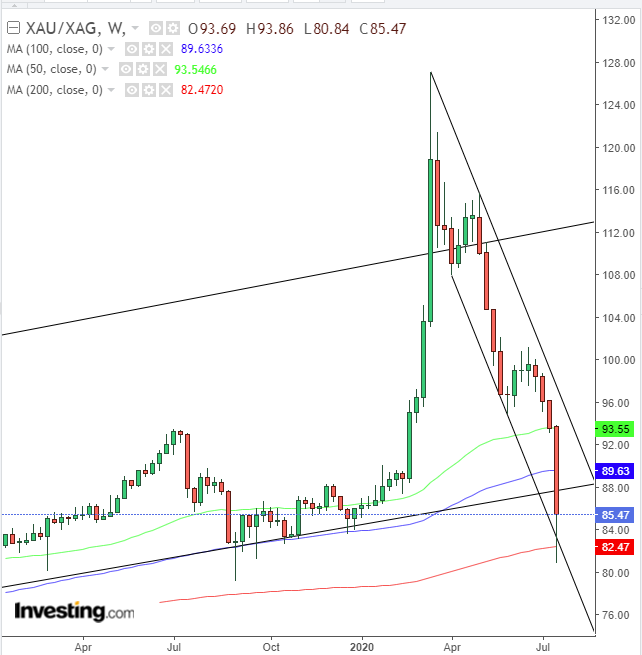
However, more importantly, the ratio fell below the rising channel that has been in place since the floor in 2011, testing too, the 200-weekly MA.

Considering the test of the 200 WMA—which has acted as support since 2013—and that the ratio has bounced off the bottom of a falling channel, we’d at least wait for a return to the channel top, if not a cross below the 200 WMA, before attempting a short.
Trading Strategies
Conservative traders would wait for the drop before the 200 WMA, which would be followed by a corrective rally, in which this dangerous moving average will act as resistance.
Moderate traders can also go short when the ratio returns to the channel top, around the 90 level.
Aggressive traders can enter a contrarian long position, as the exuberance will temporarily end, sapping demand. Then, they’d join the short appropriate for moderate traders.
Trade Sample
- Entry: 83 – likely support by hourly congestion
- Stop-Loss: 80 – below today’s lows
- Risk: 3
- Target: 92 – channel top
- Reward: 9
- Risk-Reward Ratio: 1:3
