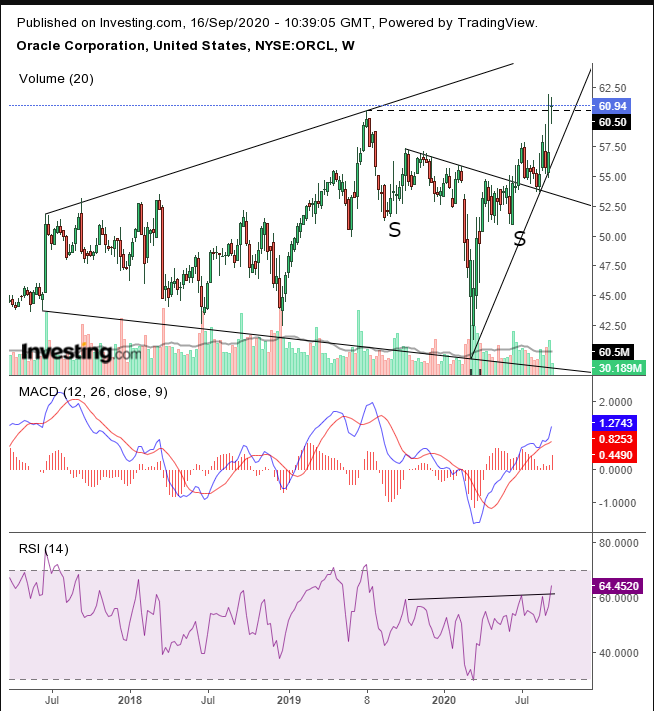
During the first minute of Monday's open, Oracle (NYSE:ORCL) shares surged 7%, and moved as much 8.5% higher for the day, after reports began circulating that the software giant had beaten Microsoft (NASDAQ:MSFT) for the bid to become a partner in TikTok, joining Chinese owner ByteDance, in order to operate the US arm of the company.
Why did the announcement create such a ravenous appetite for the enterprise information technology company's stock? Was the frenzy warranted?
Up until now, the Redwood City, California-based firm has been a successful, albeit boring B2B company. So why would investors expect Oracle to be a good match for a highly popular, youth-oriented, lip-syncing and short music video app, even when the deal itself hadn't yet been finalized, nor any specifics released?
The agitation surrounding TikTok dates back to early last year when worries surrounding user privacy surfaced along with national security concerns related to the Beijing-based company which was allegedly receiving—and possibly benefiting from—user data. In August, US President Donald Trump focused in on TikTok, as part of his ongoing trade tiff with China.
At that time, he called for a complete ban on the app in the United States. Since then, the survival of US TikTok, which has 2 billion users worldwide, has been predicated on its US operation being 'sold' to an American tech company. That stipulation seems to have evolved into a partnership proposal which must now be officially approved by the Trump administration.
According to the Wall Street Journal,
"The proposal includes Oracle Corp.’s bid to become TikTok’s U.S. technology partner as part of an effort to address the administration’s national-security concerns surrounding the Chinese-owned video-sharing app.
The deal would make Oracle the U.S. technology partner of TikTok, while allowing TikTok’s parent company, Beijing-based ByteDance, to retain a majority ownership stake, according to the person familiar with the deal.
Trump is expected to authorize the deal. Oracle's CEO Larry Ellison is a big supporter of the president, and he's previously said that Oracle was best placed to seal the deal.
And how would Oracle—which sells database technology and cloud systems to big businesses—benefit? Though details are scant right now, given that the company’s core business is data storage, TikTok's multi-billion downloads could provide a whole lot of data to harvest. The obvious monetization could be using customer information to improve the marketing of products, in much the same way as Facebook (NASDAQ:FB).
Perhaps, because traders couldn’t answer that question for themselves, after the initial, knee-jerk reaction, they trimmed the stock's profits by half to 4.2%.
So, where do we stand vis a vis trading Oracle? We’re cautiously bullish in the short- to-medium term but fearful in the long-term, after the NASDAQ 100’s uptrend weakened. Oracle may be testing the top of a broadening pattern since June 2017, which could mean that the price will be thrown back toward the bottom of the pattern.

On the other hand, Oracle has just extended its uptrend since the March bottom, besting the July 2019 peak, after having possibly completed a H&S. We say possibly because the pattern is unclear.
Were it a H&S continuation pattern it should have started since the July peak. But it first declined by 15%.
Alternatively, were it a reversal the H&S $14 height, from $40 to $54, is the lowest part of the neckline. It's disproportionately bigger than the preceding $9 decline it was meant to reverse. So we're wondering whether this trading pattern includes the psychology that fuels an H&S pattern. Are there enough disillusioned bears and reinforced bulls?
We honestly don’t know. While we recognize no discernible pattern with volume, we are, however, encouraged by the RSI that formed its own H&S bottom and the bullish MACD, all wrapped up with higher highs and a new record.
Still, this trade is risky, as on the daily chart the price may be testing the top of a rising wedge, bearish after the COVID-related sharp descent since February.
Trading Strategies
Conservative traders would wait for the price to clear the rising wedge and form accumulation above it, projecting interest sufficient to take prices higher.
Moderate traders may be content with a single, long green candle above the rising wedge, or a pullback to the pattern’s bottom, where exposure would be proportionately limited relative to potential gain.
Aggressive traders may enter a long position right now, relying on the fact that yesterday’s price closed above the preceding two days, which have fallen from opening prices, as well as a new record close. They may prefer to wait for a new all-time high. Whatever the strategy, it must be clearly laid out and followed with discipline, to limit losses and open the possibility for relatively high gains. Here’s an example.
Trade Sample – Aggressive Long Position
- Entry: $61
- Stop-Loss: $60
- Risk: $1
- Target: $69
- Reward: $8
- Risk:Reward Ratio: 1:8
