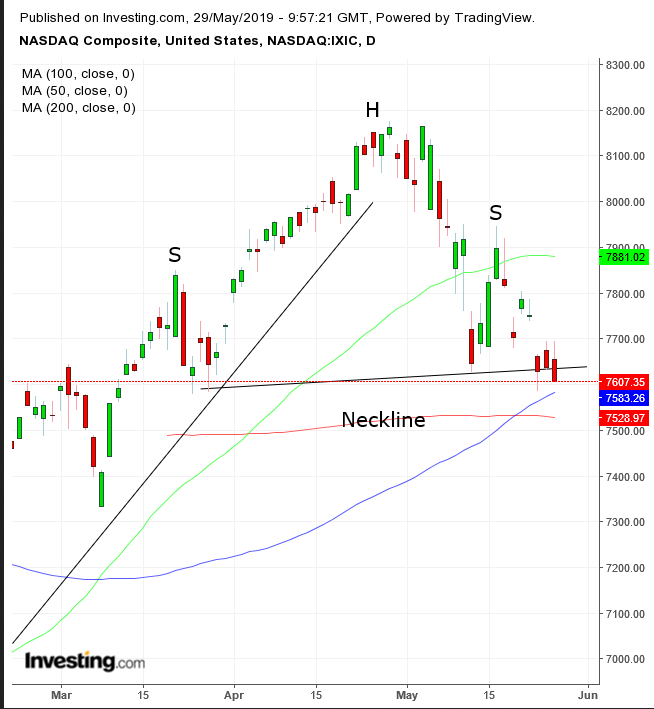
While the tech-heavy NASDAQ outperformed yesterday, we're not so sure it's a sign of more upside to come. Rather, we think, the technical charts are suggesting it may now be time to sell.
The U.S.-Sino trade war is currently dominating the market narrative, but there are other, major themes still simmering in the background. A slower path to monetary policy tightening, even a potential return to accommodation, in line with the global central banking trend, could follow the increasingly likely global slowdown being flagged by persistent disappointing inflation and plunging 10-year yields, deepening the inversion of the key 10-year to 3-month ratio, the most since 2007.
In addition, issues such as Brexit and North Korea are taking a toll too. And as these different headwinds merge into a much murkier, increasingly downbeat outlook, the patterns in the charts have begun to look a bit more ominous.

And even though technology is at the heart of the trade dispute, with the Huawei issue taking center stage, the NASDAQ's outperformance yesterday was likely to have been caused by opportunists seeing a temporary softness, offering a buying dip.
It may well prove to be that yesterday flashed a warning sign of a top, as the price closed below the neckline of a H&S top. However, we wouldn’t be surprised if the price now finds support at the March 25 low, the 100 and 200 DMA, right below the key 7,500 level.
Therefore, we’d advise investors to wait for a close below that round psychological number, to lower the odds of a bear trap.
Trading Strategies
Conservative traders would wait for a 3% filtered penetration below the neckline of 7,640 per the current angle, to a close below 7,400. Then, they’d wait for the expected return move, to retest the validity of the neckline, expressed with at least a single long, green candle engulfing a red or small candle of either color.
Moderate traders might be content with a close below the 200 DMA and the 7,500-key level. Then, they might wait for a pullback for a better entry but not necessarily for proof of a reversal.
Short Position Trade Sample
- Entry: 7,530 – 200 DMA resistance, after closing below 7,500
- Stop-Loss: 7,580, March 25, low, bottom of left shoulder
- Risk: 50 points
- Target: 7,380 – above March 8 low
- Reward: 150 points
- Risk-Reward Ratio: 1:3
Aggressive traders may enter a contrarian, long trade, counting on dip buyers bouncing off the supports mentioned at these levels, toward the 7,700 level, the highs of the past three sessions and the downtrend line since the Apr. 29 top, before presumably resuming the downtrend.
Contrarian Long Trade Sample
- Entry: 7,600
- Stop-Loss: 7,585 – Thursday’s low
- Risk: 15 points
- Target: 7,645
- Reward: 45 points
- Risk-Reward Ratio: 1:3
