Investing.com’s stocks of the week
Since the US election in November 2016, the broad benchmark for US stocks, the S&P 500 Index advanced about 35 percent, to its record high on January 29, 2018. The sector that powered the index higher was technology. That sector, as measured by its proxy the Technology Select Sector SPDR ETF (NYSE:XLK), outperformed all other sectors, advancing a shade under 50 percent over the same period.
Within the tech sector, much has been said about the infamous FAANG stocks, which were rightly given credit for the best overall market rally in years. Since the Trump election, Facebook (NASDAQ:FB) advanced 50 percent till its February 1 record, Amazon (NASDAQ:AMZN) 104 percent till its March 13 record, Netflix (NASDAQ:NFLX) almost 176 percent till its April 18 record and Alphabet (NASDAQ:GOOGL) 52 percent till its January 29 record. Their average return to date is 95.5 percent.
While that's certainly impressive, a less heralded party also deserves credit for the market risk-on: chipmakers. The Philadelphia Semiconductor Index (SOX) jumped a respectable 78 percent over the same period, helping shoulder the burden of carrying the entire stock market higher.
The growth spurt came courtesy of a global technology shift toward artificial intelligence and the Internet of Things, both of which require lots of memory and robust processor and wireless communication.
Another, less obvious boost to chipmakers came from a cultural shift toward a burgeoning asset class, cryptocurrencies, which outperformed overwhelmingly in 2017. Bitcoin advanced about 1,130 percent, arguably a jump not seen since tulip mania engulfed Dutch markets in the 17th century.
However, currently, semiconductor stocks are getting hammered on earnings weakness. The market narrative right now is focusing on the outlook for peak growth for smartphones, which means phone makers will reapportion their resources to avenues not requiring chips, leading to larger growth for them, but shrinking profits for semiconductor companies.
Another likely culprit for the slide is cryptocurrencies, which have lately underperformed.
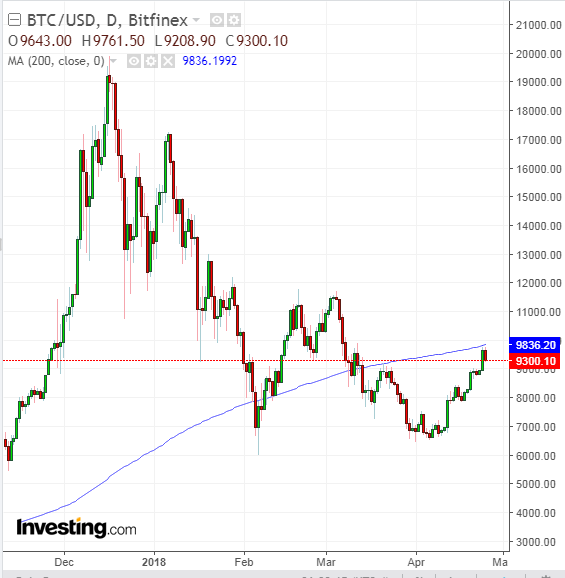
Bitcoin, for example, has plunged close to 70 percent, to its February low. It's now almost 53 percent lower than its near $20,000 peak.
In recent days, after rallying to $9,737.90 from its April low, Bitcoin has been falling today to $9291, having hit its head against the underside of the 200 DMA. During March, the most popular digital currency also tried to rally above $9,000, but banged its head against the 200 DMA and fell to its April $6,500 level low.
If digital tokens pushed chipmakers up in 2017, they've been weighing them down in 2018.

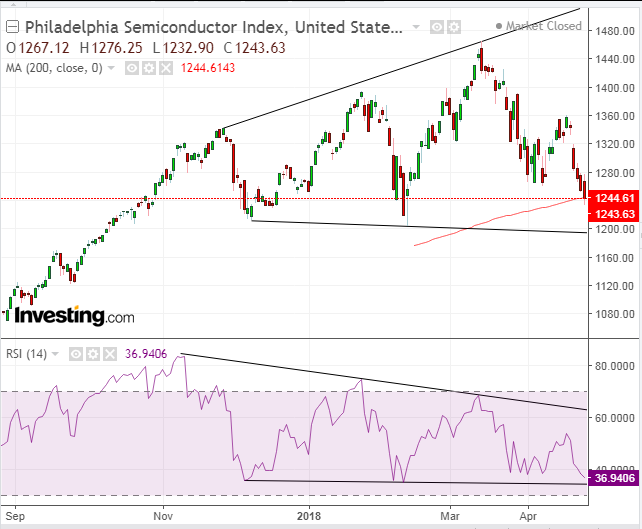
The SOX has been trading within a Broadening pattern. If a Symmetrical triangle demonstrates that both bulls and bears are determined to rally (or fall) as each gains on the other toward the middle, shaping the triangle into a symmetrical triangle, a Broadening pattern does the opposite. It starts out narrow and the further it goes, the peaks rise while the troughs descend. This demonstrates a lack of leadership, as neither the bulls nor the bears are gaining but are in fact detracting. This is a classic top pattern.
Yesterday's SOX close penetrated 1 percent below the 200 DMA but finished only slightly below it.
The RSI has been providing a negative divergence since the Broadening pattern began forming in November, when momentum began declining against a rising price. Since momentum leads price, it suggests prices will follow the RSI down. Also, the RSI has been forming a Descending triangle, an innately bearish pattern.
FAANG stocks are also consolidating in top-forming patterns; Alphabet also penetrated the 200 DMA about 0.85 percent, closing slightly below it.
If technology led the broader stock market higher, will the sector's fall signal an overall deeper correction for stocks? One can never predict with certainty of course, but the signs do appear to be aligning.

