Over the past few days, US President Donald Trump has singled out Amazon (NASDAQ:AMZN), repeatedly tweeting attacks at the e-tail giant by claiming it's responsible for all that's wrong with US retail. Critics, however, say there's a more personal motive fueling the rants; namely, Trump's anger at the retail giant’s founder, chairman and CEO, Jeff Bezos, who also happens to own the Washington Post.
It’s hard to dismiss that assertion when one of the president’s tweets paired the two in one message. The tweet calls out the “Fake Washington Post” claiming it “is used as a ‘lobbyist,'" and then connects the paper to “Amazon’s shipping costs… (and [underpaid] taxes)…” As well, the attacks started immediately after a report by the Washington Post that detailed multiple investigations into the Trump Organization’s finances, saying the business is “under siege.”
With Trump's personal rampage running in the background and an earlier tech sector meltdown already pressuring markets, Monday’s sharp downturn in US stocks—just when investors thought they might be out of the woods—may have forced the president to reconsider his 'war' on Amazon.
On Monday evening, after the Dow closed more than 450 points lower, Peter Navarro, Director of the White House National Trade Council (something newly created by Trump), said “the smart money is certainly going to buy on the dips here because the economy is as strong as an ox.”
Putting aside whether such an unusual White House move against a mega cap US company is smart in case of a downturn, it signaled to investors that the president will now lay off Amazon which is what originally triggered Monday’s plunge.
After the market closed yesterday, the White House increased tariffs, targeting Chinese high-tech imports; this morning China responded in kind, levying taxes on $50 billion worth of US products. US futures plunged, along with Asian and European stocks.
However, as opposed to the broader S&P 500, the technology sector did not fall below the 200 dma, beneath its uptrend line. Nor did it complete a bearish pennant.
Even after the recent selloff, the sector is still one of only two on the benchmark index remaining in the green for the year, up 0.84 percent, second only to the Consumer Discretionary sector with its 1.00 percent gain.
Amazon, a tech sector leader, outperformed, up 19 percent YTD, even after losing half its gains this year via the correction from late January. It is also 24 percent above the uptrend line since February 2016.
On the downside, on Monday it fell below a shorter-term uptrend due to its sharper rally since October 2017, compared to the rest of the market.
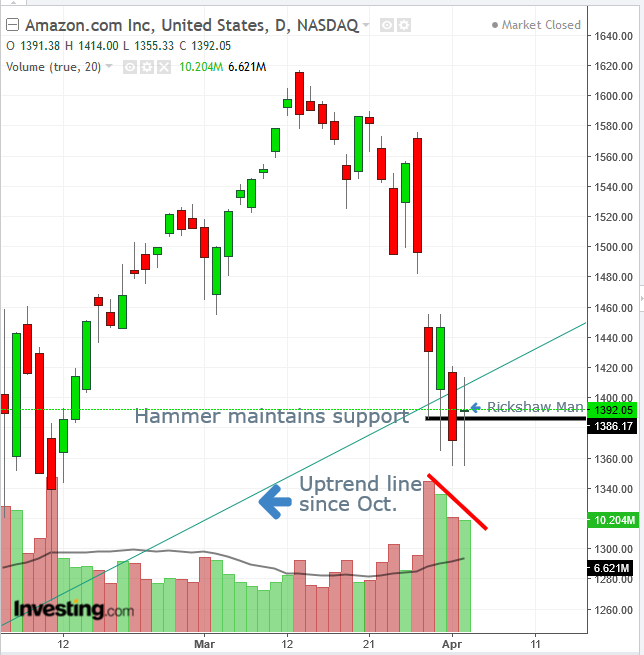
On the positive side, it is well above its 200 dma, which, on Monday, the S&P 500 crossed below, sounding alarms on Wall Street of a possible negative trend reversal. However, last Wednesday’s hammer is maintaining support.
While the stock rose yesterday by 1.36 percent, it was subject to wild swings—whipsawing between a 1.15 percent loss and 3 percent gain. This down and up and down activity formed a Long Legged Doji (Rickshaw Man). It's a rare candle that often precedes reversals, a visual representation of the “changing of the guard” of the current trend. It's especially potent when formed at important technical junctures and when accompanied by heavy volume.
The former is more than satisfied, coming after a plunge to the uptrend line since October and the support of Wednesday’s hammer. The latter is less convincing. While volume is higher than it's been during most of the year, it is the lowest in the last four sessions, the recent selloff, egged on by the president.
So, while the entire market is down on an escalating trade war, Amazon, ironically, is in a superior technical position. There is currently potential for bulls to reenter, especially after Trump's proxy, Navarro, signaled the president will lay off Amazon going forward.
Trading Strategies – Long Position Setup
Conservative traders would wait for a new, higher peak, above the March 13 $1,617.54 peak.
Moderate traders might be satisfied with a return above the uptrend line, at $1,420 by the current angle.
Aggressive traders may enter a position now, with a stop-loss below Tuesday’s $1,355 low.

