While all four major US indices—the S&P 500, NASDAQ Composite, Dow and Russell 2000—rose for the third week, and even as three of the four also posted new records, the real market story right now is bonds.
On January 14th, we had pointed out that while rising yields are generally bullish, the fact that the 2-year yield rose more than the 10-year yield (they rose 4 percent and 3 percent, respectively), suggests bond investors are not yet committed to joining equity investors in their positive outlook for rising economic growth.
Last week, that ratio reversed. Furthermore, there were additional signals for a trend reversal. In order of ascending importance:
- The 10-year Treasury yield climbed to 2.661 percent, 0.2 basis points under the high price of the day. This demonstrates that bears are committed and in charge, holding onto their conquered territory. A closing price is more important than the intraday level, as it demonstrates investor faith in the position, indicating they are willing to remain exposed until the following opening. That demonstration is compounded with a weekend close, when there’s more time for things to go wrong.
- The 2-year Treasury yield climbed 3.4 percent, while its 10-year counterpart climbed 4.35 percent. As discussed, this demonstrates more faith in economic growth (see below for a simple explanation).
- The 10-year yield reached the highest level since 2013.
- The 10-year yield registered a new peak above the December 12 level, 2.641 percent, completing a second peak of a new peak-trough uptrend for yields, which means a new downtrend for bonds. This reversal signals that bond investors agree with equity investors for continued economic growth for the first time since the 2016 so-called Trump rally.
Bond Supply And Demand: 2 Motivations
Supply and demand for bonds is characterized by two basic motivations.
The first is growth versus security. Do investors seek security and would they therefore rotate funds out of stocks and into bonds? This would demonstrate pessimism on company growth because of weakened economic expansion. Or would they seek growth and therefore rotate funds out of bonds and into stocks, demonstrating optimism on company development because of stronger economic advancement?
The second motivation is current versus future yields. Do investors believe that the current yield is the best they can get, thereby increasing demand for bonds and demonstrating pessimism on economic growth, which brings interest rate hikes and higher yields? Or do they believe the current yield is not yet the best they can get and are waiting for economic growth to provoke the Fed into raising rates, which would push yields higher, demonstrating optimism on economic growth?
Note, the common denominator for either motivation is that an outlook for economic growth reduces demand for bonds, whether due to a rotation into stocks or to investors holding out for higher yields; while an outlook for economic contraction increases demand for bonds, whether due to rotating into the safety of bonds or to grabbing the best yields available before they turn lower.
What Unified Equity/Bond Optimism Means For The Dollar
Investors generally buy or sell the dollar according to their outlook of the US economy. It stands to reason, therefore, that the rare equity-bond unified optimism would affect the dollar.
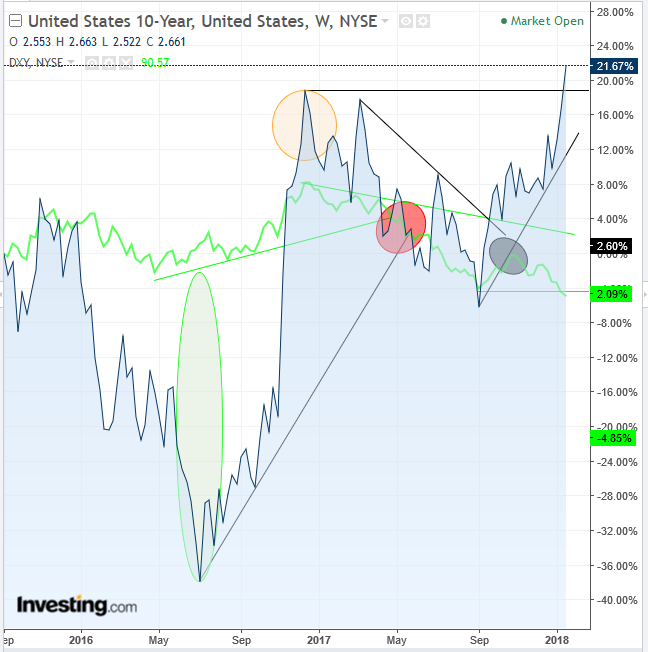
A positive correlation is evident in the rally of both assets from August 2016 (green oval), then in the simultaneous decline since December 2016 (orange oval) and finally when both assets crossed above their respective downtrend lines, green for dollar, black for bonds (red oval).
However, the correlation broke down when the dollar fell in October below the uptrend line that had existed since September (black oval).

The dollar index stopped a sharper decline last Monday, when bulls pushed back from the low price of 90.28 to the closing price of 90.97, the high price of the day. This bullish reversal formed an exceptionally powerful bullish hammer, commensurate to the exceptional length of its lower shadow, especially relative to its miniscule real body.
The psychology that follows this candlestick is that shocked bears, who presumed a victory, may unwind short positions, increasing demand. That takes prices higher, potentially causing more short coverings. Finally, dip-buyers identify a consolidation before a reversal and add to the demand.
However, in the following four trading sessions since Monday, while the price respected the hammer’s support, it failed to trade higher. Its trading pattern formed the continuation flag pattern. Like the proven flag at the beginning of the year, a downside breakout would signal a resumption of the prevailing downtrend.
Trading Strategies
Conservative traders would wait for the downside breakout of at least one full, average candle beneath the flag, a correction toward the pattern, in which it confirms its integrity with a down-day that covers the preceding up-day’s real body.
Moderate traders may wait for the downside breakout and the return move but not necessarily for a confirmation, achieving an entry closer to the pattern resistance and hence a superior risk-reward ratio.
Aggressive traders might wait for the breakout but not wait for the return move and may enter immediately, providing they can either afford a stop-loss above the flag bottom or the risk of loss.
Author's Note: Profits and losses of trading are not measured with the success or failure of individual trades. A losing trade is the cost of trading, just like putting money into any business is not considered a loss but an investment. A trader must ensure the following 3 things when considering an analyst's trading signals: (1) Understand the trade parameter – it isn’t simply “up” or “down,” and that’s it. There are conditions. (2) Pay attention to the entry and exit price, and that it provides a risk-reward ratio of at least 1:3. (3) Trade only when resources and temperament allow it.
