by Pinchas Cohen
GE Stock Plunges...Again
On October 10 we posted a bearish forecast for General Electric (NYSE:GE). It followed the sudden Stanley Fischer-like departure of CFO Jeff Bornstein, a few weeks after an announcement that Jeffrey Immelt, the Director and Chairman of the company’s board of directors, had quietly retired, two months ahead of schedule.
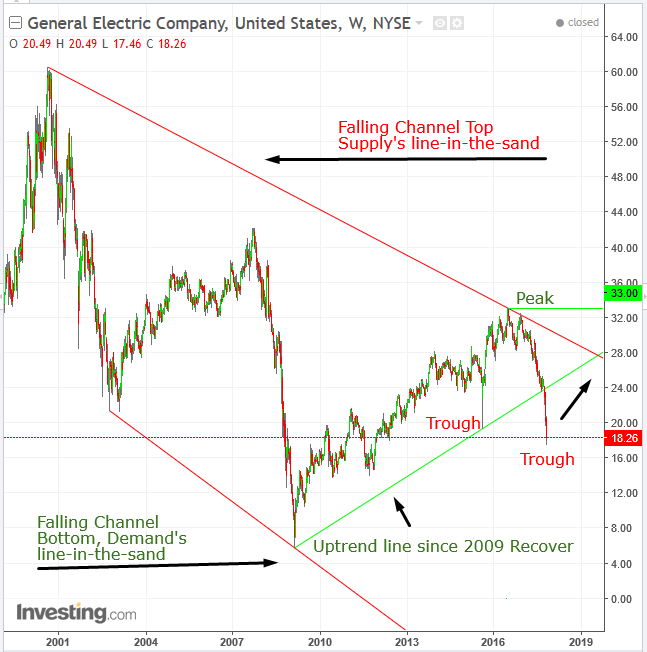
This caused investors to begin imagining all sorts of horrors key managers at the company might be fleeing from. The stock completed a continuation pattern within a falling channel, signaling lower depths. At the time of our post, the stock price was $23.43. Now shares are at $18.26, a drop of $5.17 or 22 percent a little over a month later.
The latest plunge – which occurred on Monday and Tuesday – followed the company's announcement that it will cut its quarterly dividend in half, lowering the payout to 12 cents per share. The company also shared the news of its restructuring plan.
Buying Opportunity?
Bank of America Merrill Lynch considers this a buying opportunity. They believe the company has “significant cost-cutting opportunities under the new leadership,” including cutting 50 percent of its dividend.
It’s easy to understand why the firm considers this a buying opportunity, as GE has been the worst performer in the Dow Jones Industrial Average this year, falling 42 percent. Being the worst performer can also be viewed as having the cheapest shares.
We, however, hold a bearish view.

Two Decades Of Underperformance
It's clear from the chart that the price is in a secular (decades long) bearish trend, ever since the dotcom crash. While the market at large transcended the highs of 2000, in 2008 and 2016, GE has made descending highs. This demonstrates that not only has it underperformed, but it has done so for nearly 18 years running.
Still, since the 2009 recovery, GE was in an uptrend, pitting opposing supply-demand forces between the secular term, since 2000; the midterm (months in length); and the long-term (years in length), starting at 2009. This isn’t an ideal state for investors. However, the conflict may have ended when the uptrend line since 2009 was violated in the week ending October 9, when we wrote our bearish post.
Now, both the secular trend and the mid-term to long-term trend agree that things are looking down for GE. This is not to say that an upward correction won’t take place. They often do after a breakout.
Furthermore, while the uptrend line since 2009 may have been breached, the price has yet to register the minimum required two descending peaks and troughs to constitute a downtrend for the mid to long term. While the price registered two descending troughs, $19.37 on August 24, 2015, and the current, lower price, it registered only one peak, $33.00 on July 18, 2017. Once a lower peak is registered, we will have an official mid to long term downtrend. Note that it is only considered a peak after a minimum decline of one third of its rally.
Trading Strategies
Conservative traders would wait on a short position for the likely return move to the secular channel-top, followed by lower prices, at least enough to cover the last up day and verify the integrity of the channel.
Moderate traders may wait on a short for a return move toward the channel-top or the broken uptrend line since 2009 and see that prices halt on resistance.
Aggressive traders may enter a short now, provided their account can afford a stop-loss above the $29 channel-top or the risk.
