by Pinchas Cohen
This past Friday, General Electric (NYSE:GE) CFO Jeff Bornstein dropped a bomb on markets by unexpectedly announcing his retirement. This, just weeks after it was announced by the company that Director and Chairman of the company's board of directors, Jeffrey Immelt, who was scheduled to retire at the end of December, had already retired—two months earlier than expected.
Stock Tumbles On Bornstein Stunner
Investors, who were already a bit unsteady on the stock and the company after the Immelt surprise, were sorely disappointed at losing Bornstein too, an insider they valued as a straight talker and cost-focused key executive. The market punished the company with a sharp, 4-percent selloff, GE's biggest plunge in 15 months.
In a year during which the stock price had already fallen by 25 percent—meaning it is now underperforming by a staggering 39 percent—against a market backdrop that's up roughly 14 percent, the unexpected retirement announcement was oddly reminiscent of Fed Vice Chairman Stanley Fischer’s sudden retirement notification in early September.
At that time, we said of Fischer:
Some hypothesize that his sudden resignation for “personal reasons” is an escape in front of an economic hurricane he doesn't want to weather, at the end of a decade-long run of global QE.
Similarly, with regard to General Electric, some analysts have been raising concerns that recent management changes are due to deeper troubles the company is facing which have not yet come to light.
More Trouble Ahead?
Might these hidden ailments be detected via the balance of supply and demand, visually recognizable on the stock’s chart?

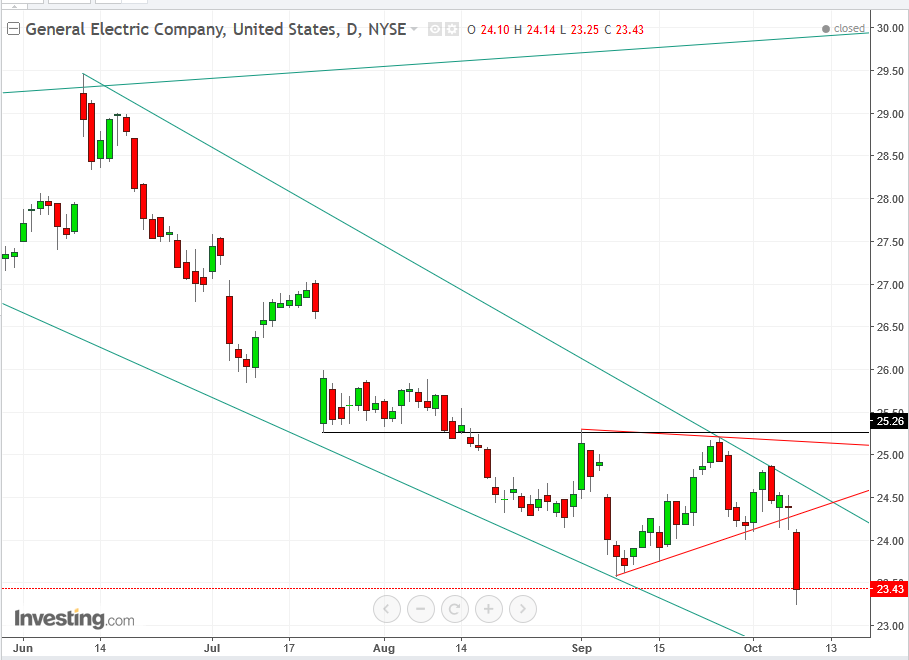
Between July 21 and August 15, the $25.25 level attracted buyers, forming a support for the price. However, once that support was broken on August 15, the support at that level turned into resistance.
Bulls tested that line of defense on August 15 and 16, then tried again on September 1, reaching an intraday high of $25.30 but were driven back by the bears, and the price closed at $25.14. Finally on September 26, it reached the lower high of $25.21. After that, whatever demand was still directed at the stock no longer managed to make it as high as the $25.25 resistance, but rather, petered out at $24.85.
This trading pattern formed a symmetrical triangle, generally a continuation pattern. It demonstrates a pause in the preceding trend. The more trading continues from there, the more the price contracts, lulling investors into believing that the price has reached fair value, that the market forces of supply and demand have reached an equilibrium. But what appears to them as peace is really nothing more than an untenable cease fire.
Opposing forces are counting their dead, patching up their wounded and getting ready for one more decisive battle, winner take all. The opening shot is heard and they rush at each other like two hungry sumo wrestlers, whose next meal will be given only to the victor of the match. The side that is able to push its opponent outside of his boundary is declared the winner; the prize: an all-you-can eat pass.
Yesterday, the bears decisively pushed the bulls out of their boundary, paving the way for emboldened bears to add to their positions while beaten bulls joined the winning side and former spectators now have an opportunity to get in on the action – a triangular, multi-faceted force, whose apex points down.
Trading Strategies
Conservative traders would wait on a short for a confirmation of the pattern’s integrity, which includes a return move and an assertion of the now-resistance of the triangle bottom. During the pattern development, the buying dips formed a support line, but the downside breakout is expected to have reversed that psychology. Conservative traders confirm this after it proves it has become a resistance, by a close as low as the candle that attempted to reach it.
Moderate traders would wait on a short with a return move.
Aggressive traders may short now, providing they either are willing to set the stop-loss above $24.50 to accommodate a whipsaw return-move or accept the risk of loss.
Very aggressive traders may enter a long, counting on “seller’s remorse” psychology among traders who may feel they have gone too far, spurring the roughly 65-percent chance of a return move, before they join the market with a short.
Profit Target: The pattern’s implication is measured by its height, forming the minimum target of $22.60
Risk-Reward - How to Get on the Good Side of Statistics
A common trader mistake is to cut wins (on fear of exiting on a loss) and run with their losses – deluding themselves into believing that the price will turn around, thereby digging an ever-deeper hole. Traders must do the opposite: cut losses (to avoid losses...duh) and run with their wins to milk the trend, cover both losses and cost of trading and allow themselves the chance to incur a profit.
A classic risk-reward ratio is 1:3. In this way, a loss won’t take your account to the point of no return, and a win will make up for several small losses. That means when traders select a stop-loss, they should factor in the target profit, consider its viability, then stick to it. Otherwise, they fall back into a negative risk-reward ratio, by increasing risk and limiting reward probabilities. These catch up with you.
