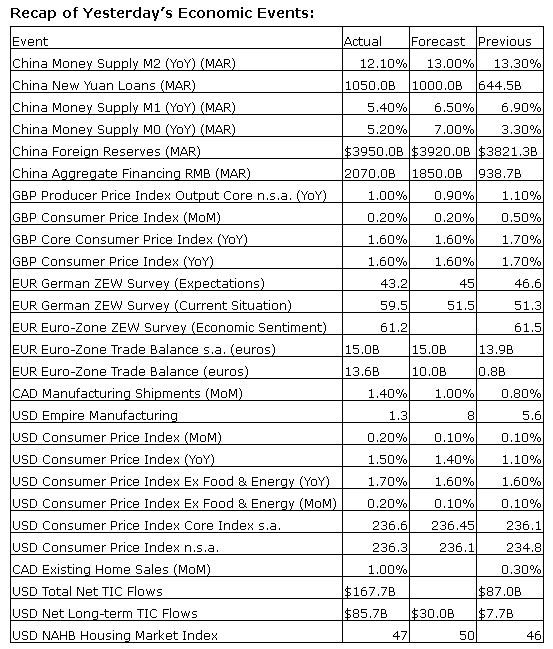
Upcoming US Events for Today:- Housing Starts for March will be released at 8:30am. The market expects 965K versus 907K previous. Building Permits are expected to post a marginal decline of 1.010M versus 1.018M previous.
- Industrial Production for March will be released at 9:15am. The market expects a month-over-month increase of 0.4% versus an increase of 0.6% previous. Capacity Utilization is expected to tick lower to 78.7% versus 78.8% previous.
- Weekly Crude Oil Inventories will be released at 10:30am.
- The Fed’s Beige Book will be released at 2:00pm.
Upcoming International Events for Today:
- Great Britain Labour Market Report for March will be released at 4:30am EST. The market expects the claimant count to decline by 30,000 versus a decline of 34,600 previous. The Unemployment Rate is expected to tick lower to 7.1% versus 7.2% previous.
- Euro-Zone CPI for March will be released at 5:00am EST. The market expects a year-over-year increase of 0.5% versus an increase of 0.7% previous.
- Bank of Canada Rate Announcement will be released at 10:00am EST. The market expects no change at 1.0%.
The Markets
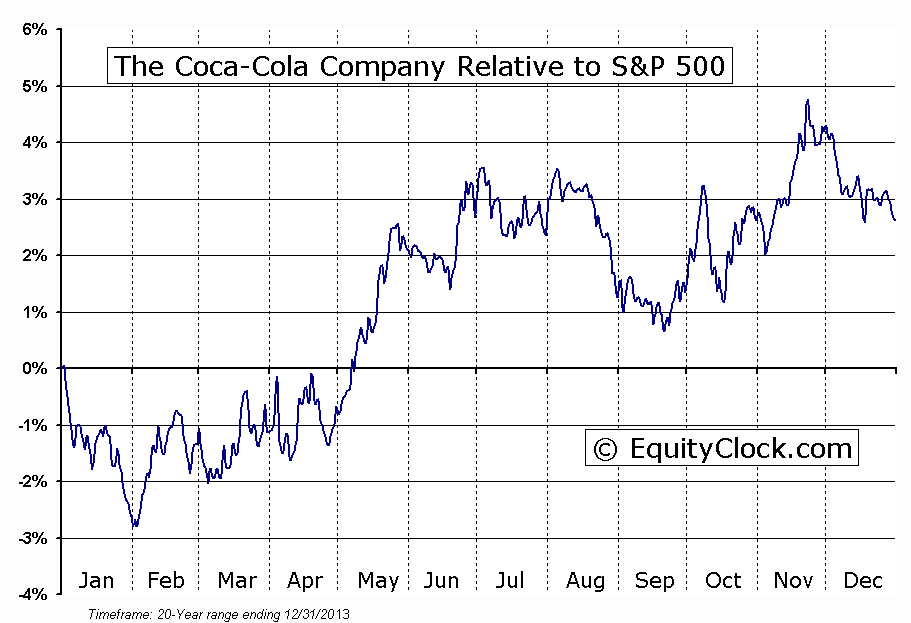
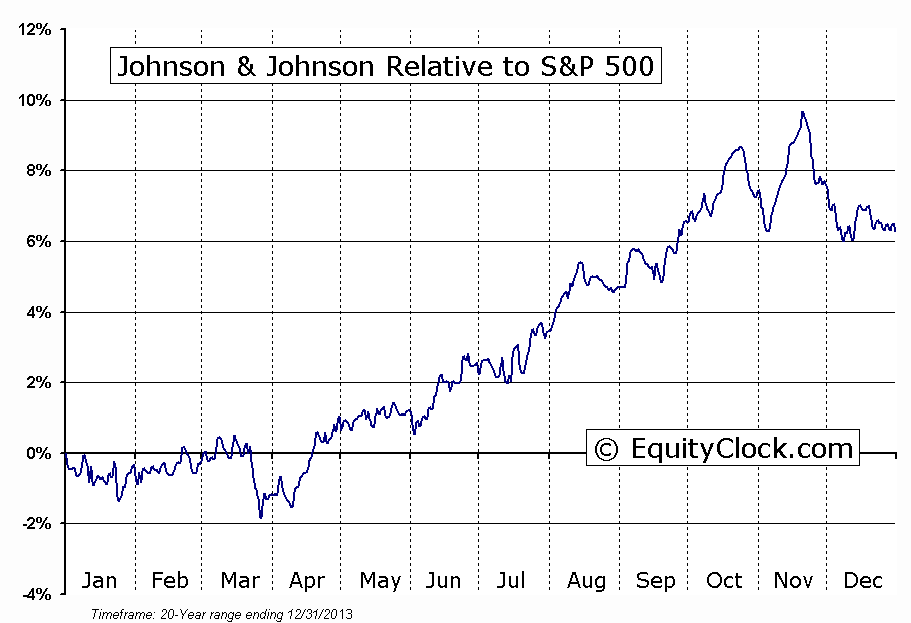
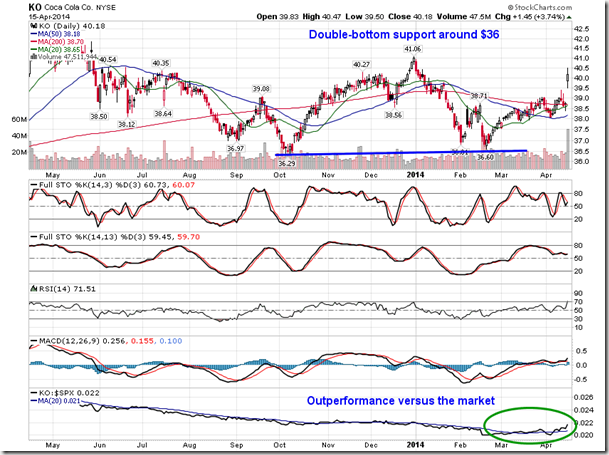
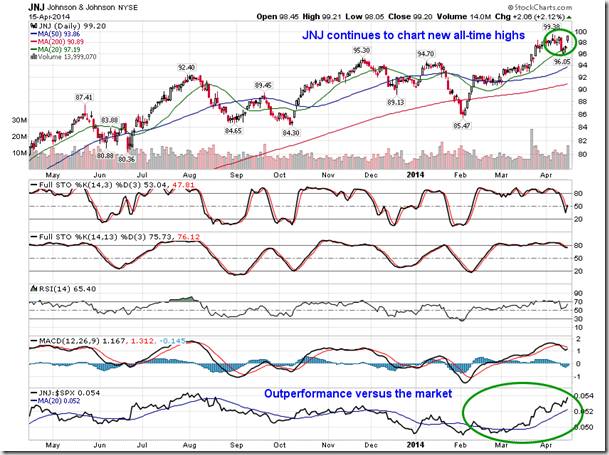
Stocks ended higher after a volatile trading session as investors received better than expected results from Coca-Cola Enterprises Inc (NYSE:CCE) and Johnson & Johnson (NYSE:JNJ); the two blue-chip companies ended higher by 3.74% and 2.12%, respectively, accounting for almost a quarter of the gain in the Dow Jones Industrials Average. Coca-Cola continues to rebound from double-bottom support around $36, while Johnson & Johnson continues to chart new all-time closing highs; both stocks have outperformed the market since the beginning of March and the direction of the major moving averages (20 and 50-day) continue to point higher, implying positive short and intermediate-term trends. Seasonal tendencies for Coca-Cola remain positive through to the end of June, while seasonal tendencies for Johnson & Johnson remain positive through to November.
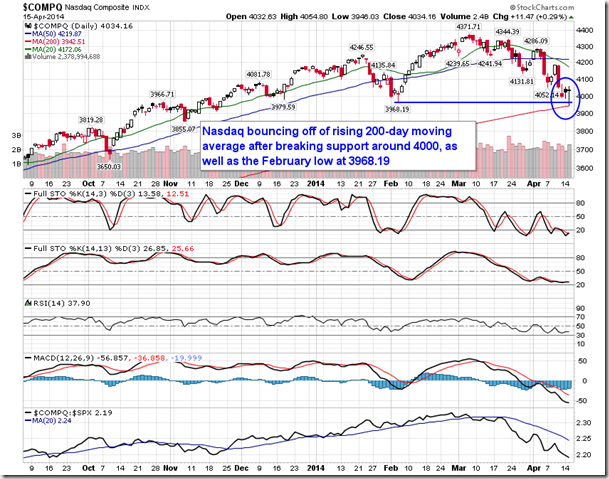
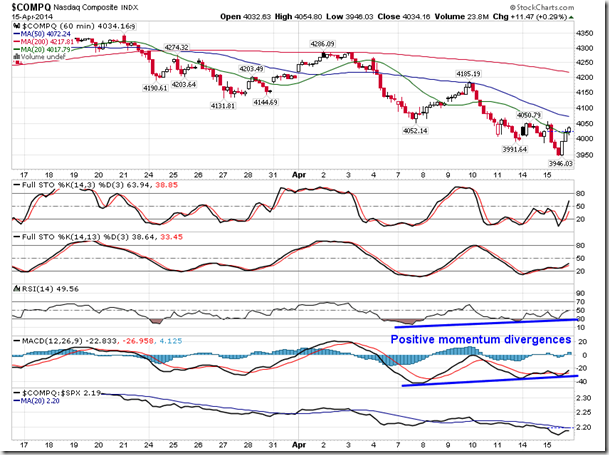
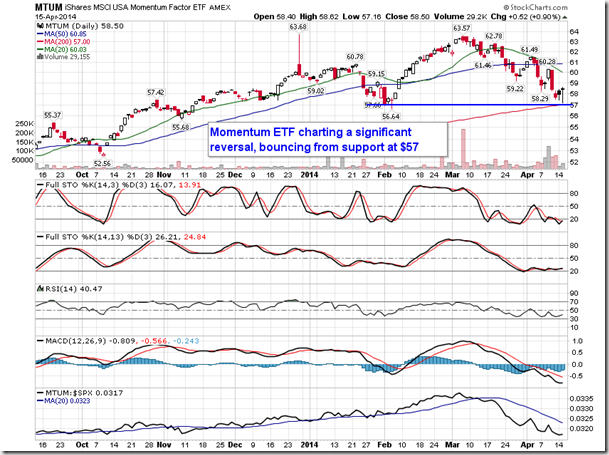
Stocks had swung between gains and losses during Tuesday’s session, eventually amounting a rally within the afternoon trade to record firm gains on the day. The Nasdaq broke below support once again at 4000 and also broke below the February low at 3968.19 before bouncing off of the rising 200-day moving average, escaping the strong selling pressures during the midday trade; support on a closing basis remains intact at 4000. After a substantial move lower since the beginning of March, momentum indicators for the tech heavy benchmark are showing signs of exhaustion, hovering around oversold levels; downside pressures may be waning As mentioned in yesterday’s report, the Nasdaq is concluding a period of seasonal weakness, which runs from the end of January through to mid-April. The benchmark typically attempts to find a low around this time of year, just as earnings from key tech companies are reported. The present seasonal and technical parameters continue to give the benchmark a good chance of bouncing following the almost 10% decline, from peak to trough, over the past month and a half. Resistance remains apparent at a declining 20-day moving average. A rebound in momentum stocks, as gauged by the Momentum ETF (MTUM), helped the Nasdaq recover during the afternoon trade; MTUM is also finding support at a rising 200-day moving average.
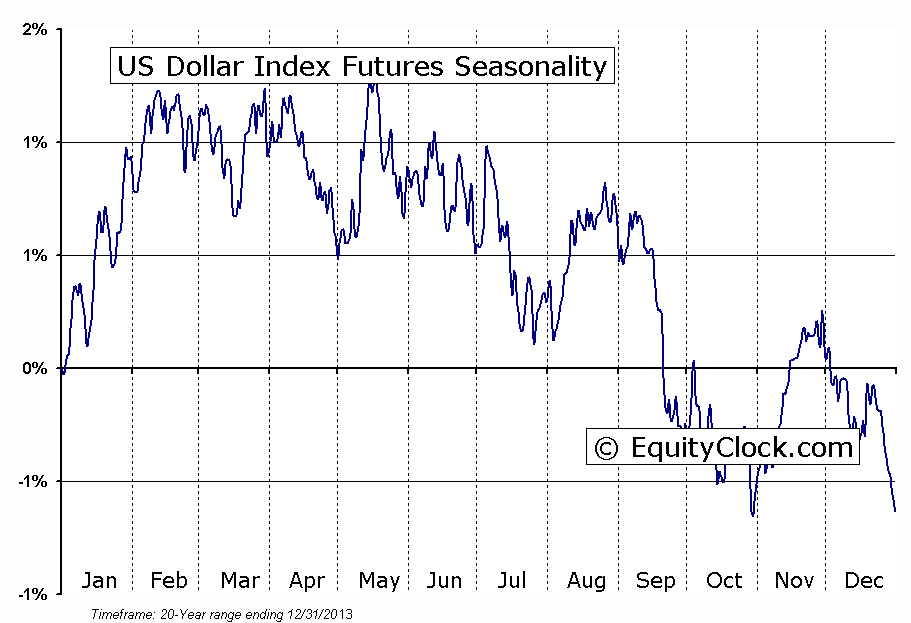
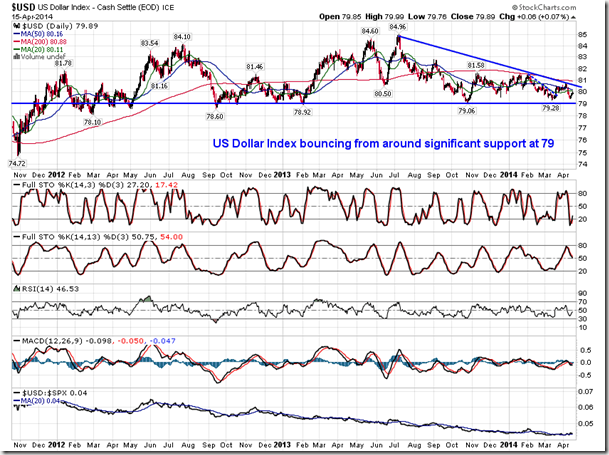
One thing that continues to be a threat to the equity market over the intermediate-term is the US Dollar. The US Dollar index is once again bouncing from significant support at 79, suggesting a floor to the currency benchmark that has remained intact since 2012. The implication is that the US Dollar index has nowhere to go but higher, a trend that has a good potential to negatively impact the equity market in the US. Over the last nine months, the currency benchmark has been trading within a pattern that resembles a descending triangle, which is typically a continuation pattern should support be broken; resistance is immediately overhead around 80.50. The imminent breakout from the pattern, either higher or lower, will determine the direction over the intermediate-term. Seasonal tendencies for the US Dollar Index are typically negative through the summer months.
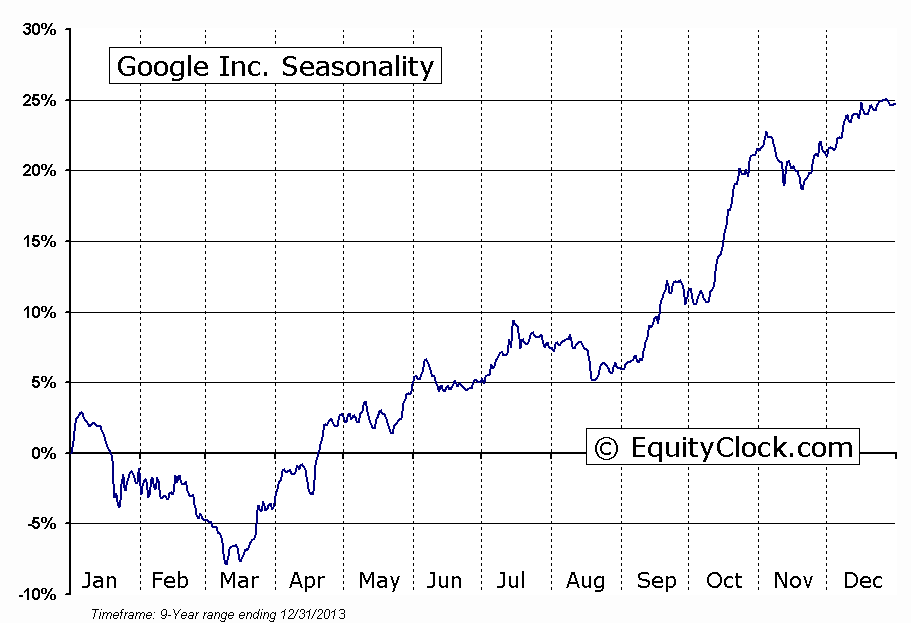
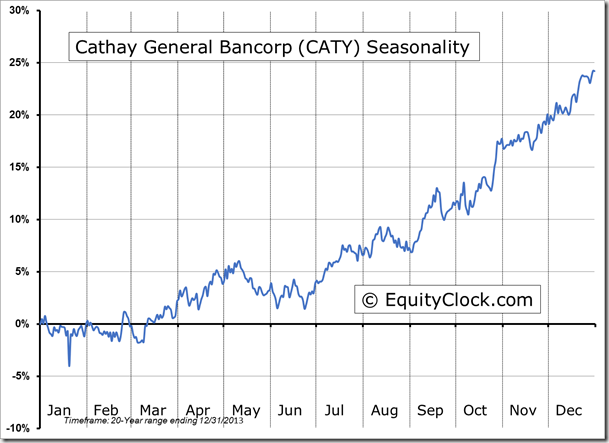
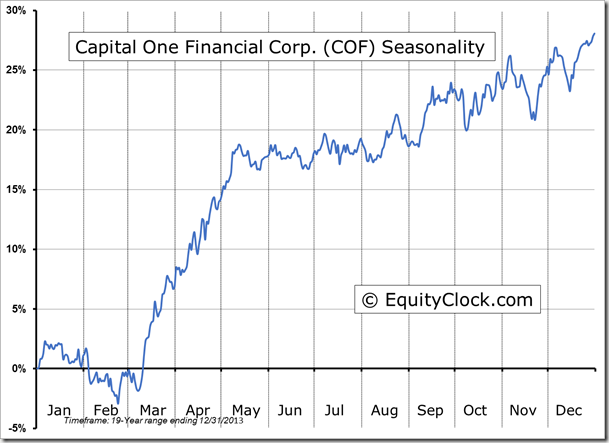
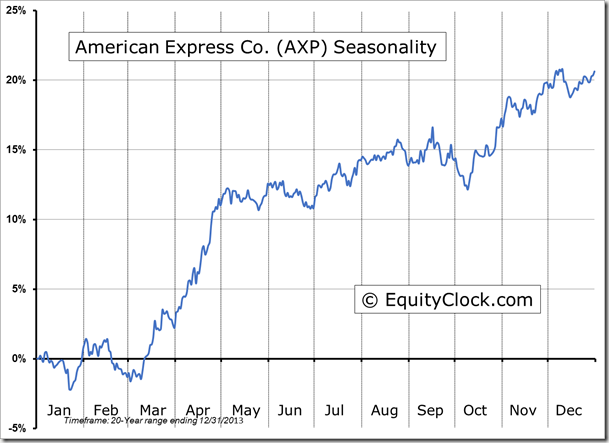
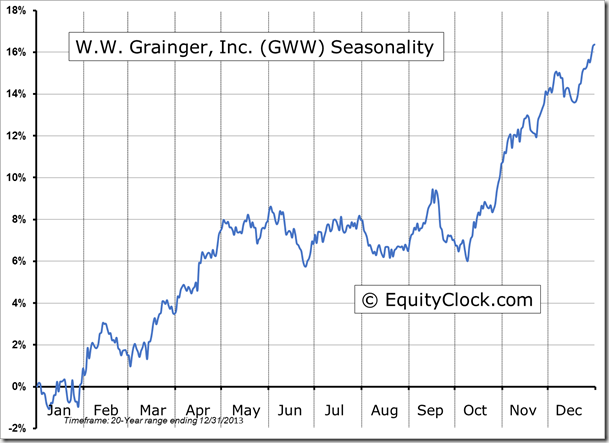
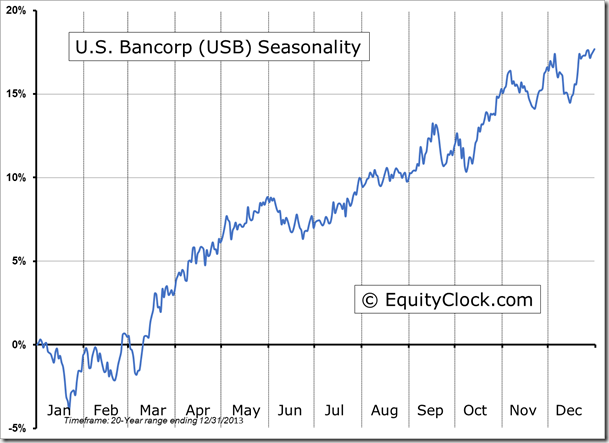
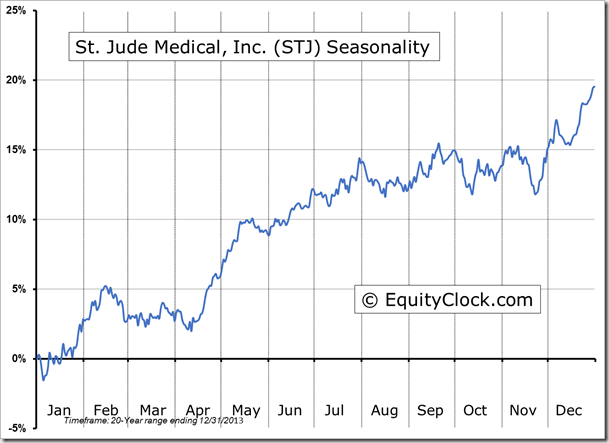
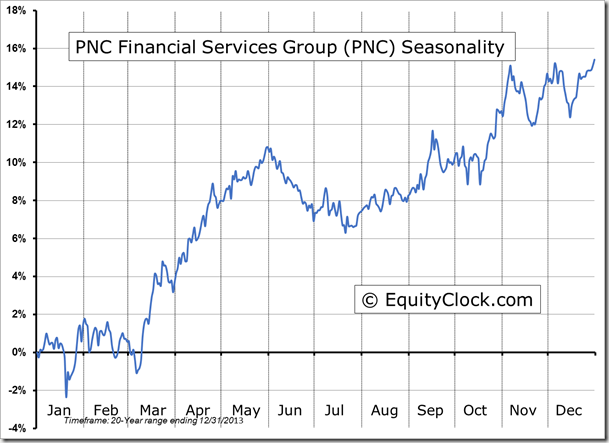
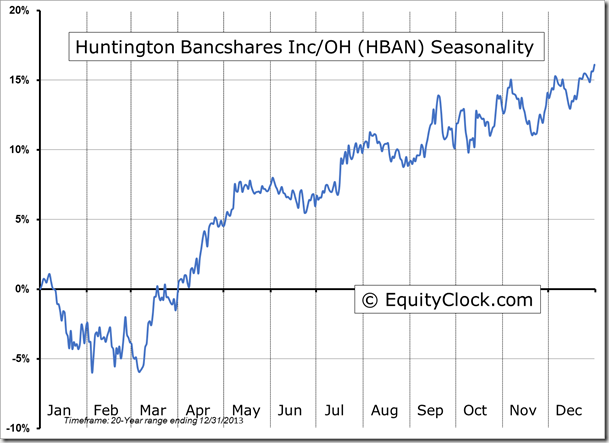
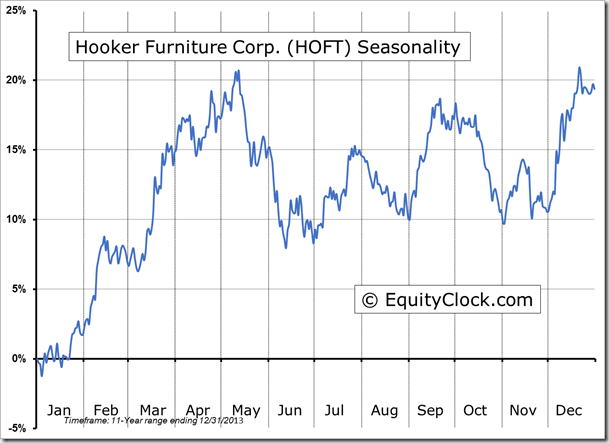
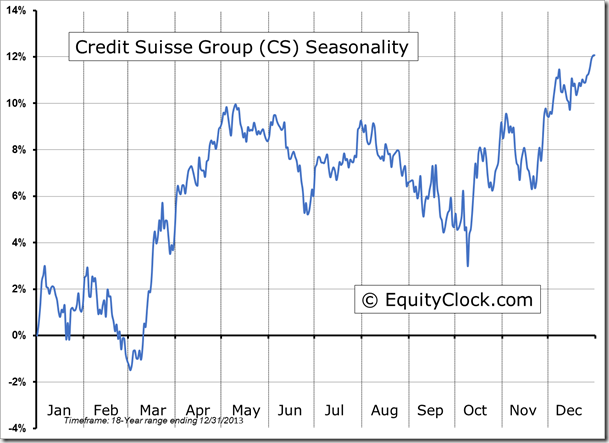
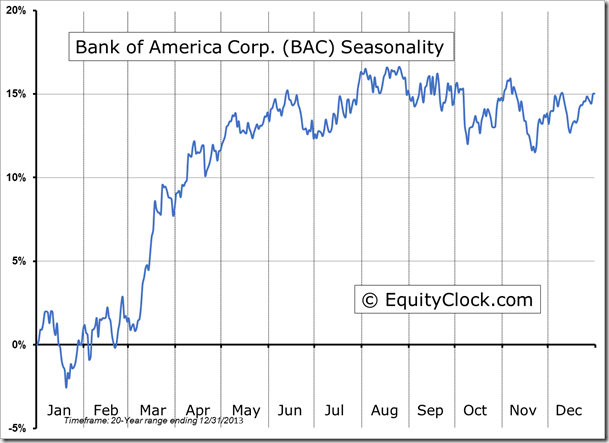
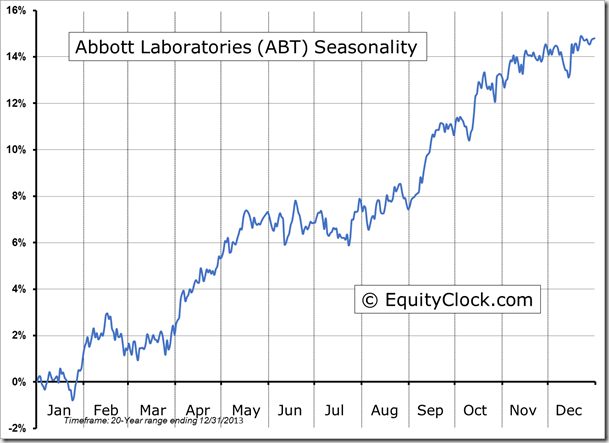
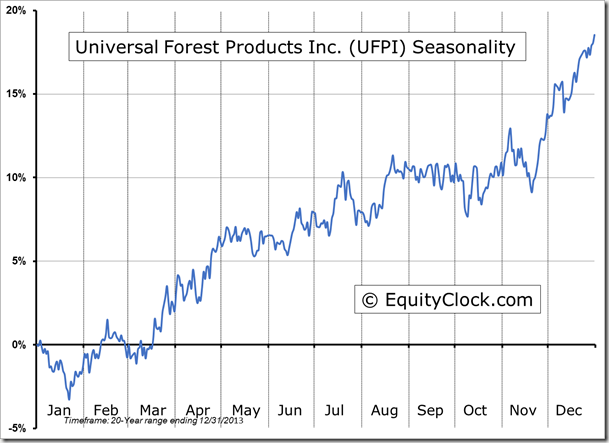
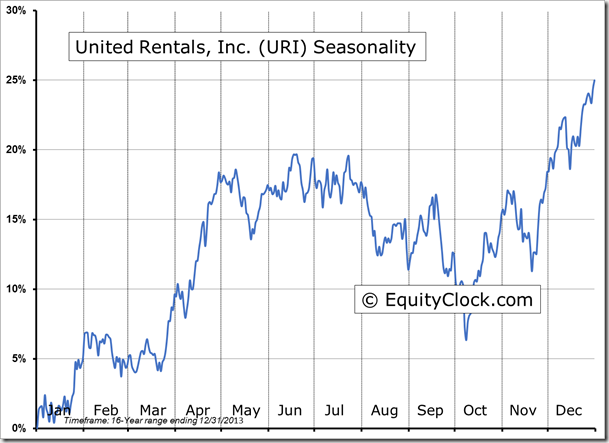
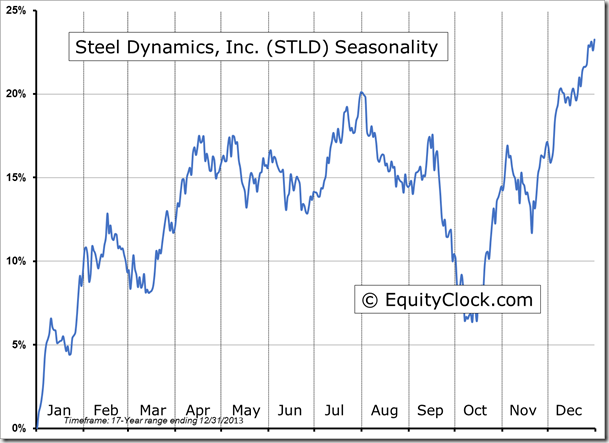
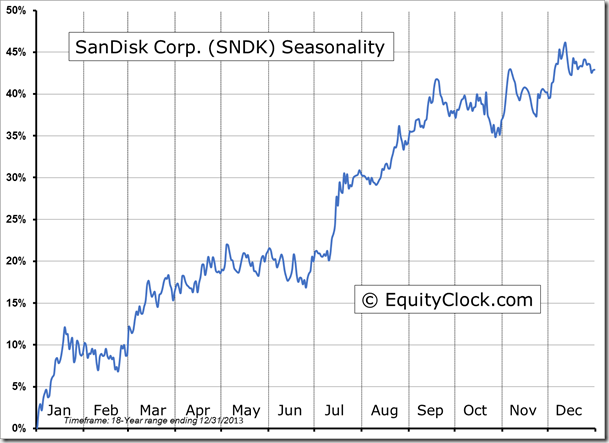
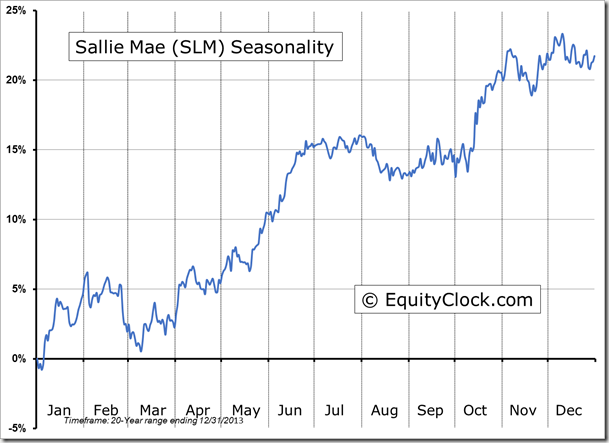
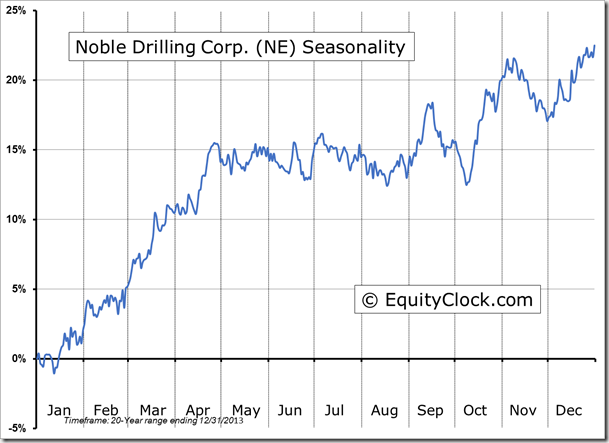
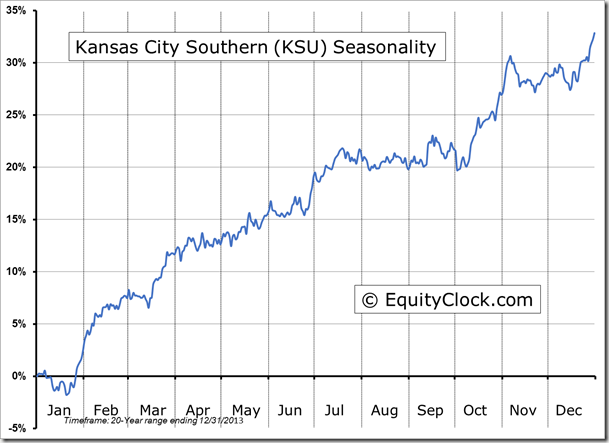
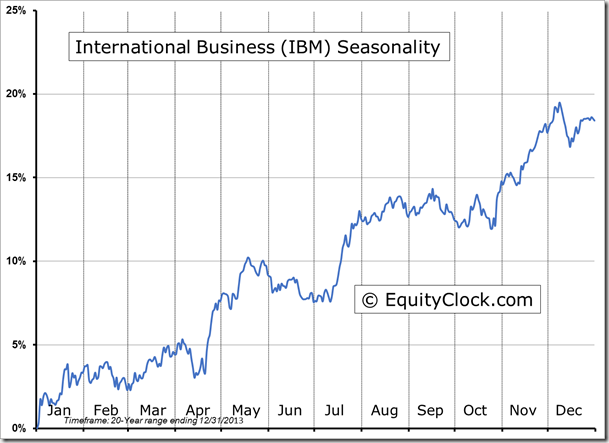
Seasonal charts of companies reporting earnings today:
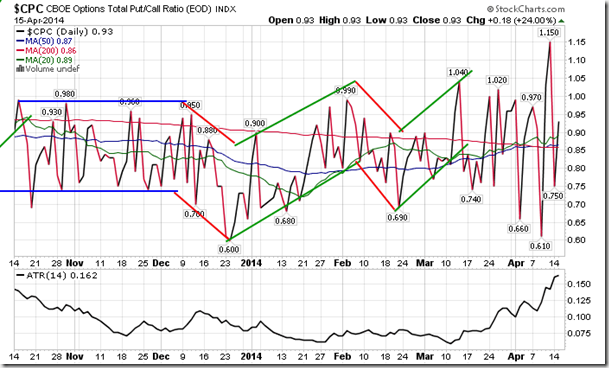
Sentiment on Tuesday, as gauged by the put-call ratio, ended bullish at 0.93. The 14-day average true range of the ratio continues to hold around the highest levels in over a year after bouncing from the lowest level since 2000; this abrupt shift from complacency to volatility is typically a negative for stocks.
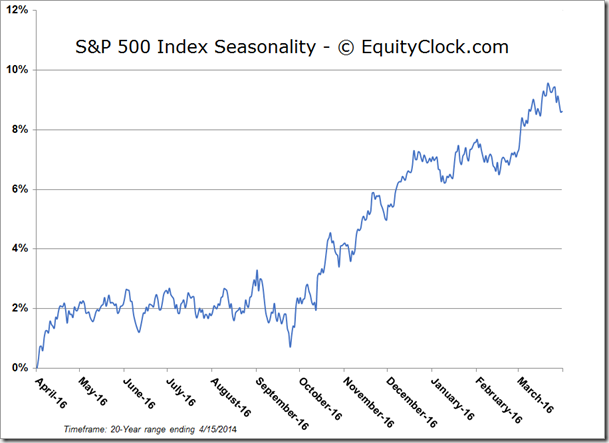
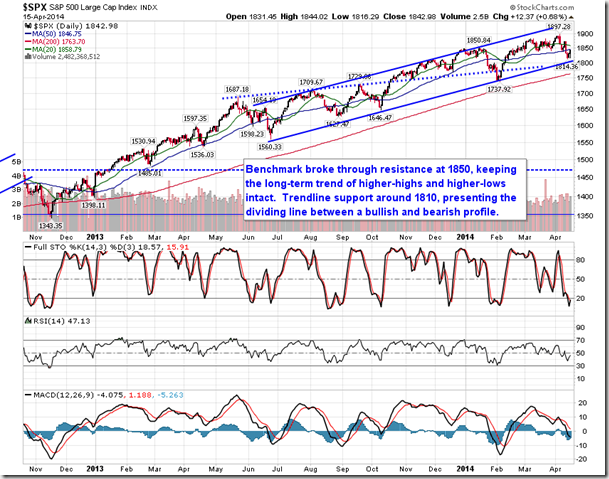
S&P 500 Index
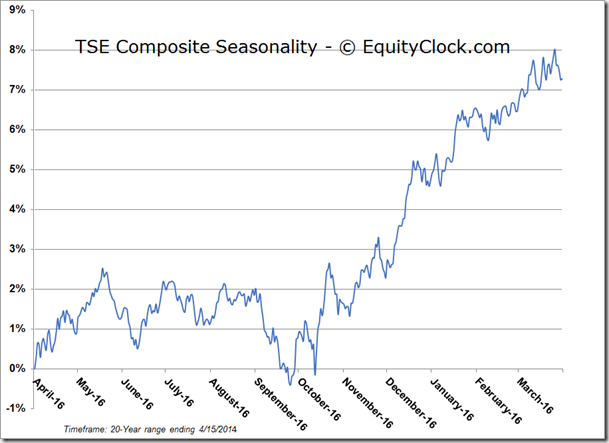
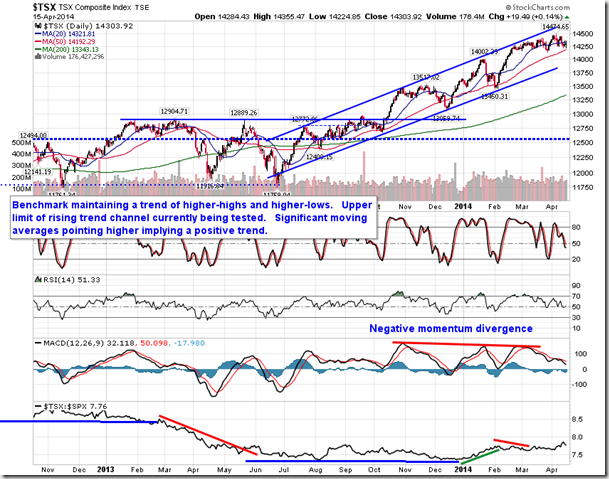
TSE Composite
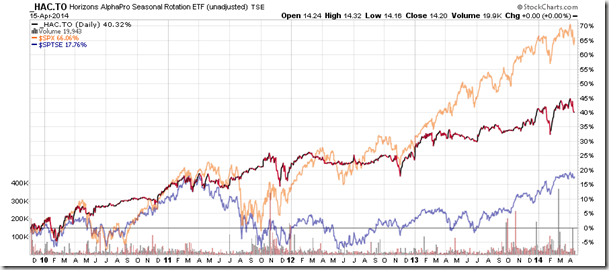
Horizons Seasonal Rotation (HAC.TO) ETF
- Closing Market Value: $14.20 (unchanged)
- Closing NAV/Unit: $14.33 (up 0.57%)
Performance*
| 2014 Year-to-Date | Since Inception (Nov 19, 2009) | |
| HAC.TO | 0.21% | 43.3% |
* performance calculated on Closing NAV/Unit as provided by custodian

