AT40 = 24.1% of stocks are trading above their respective 40-day moving averages (DMAs)
AT200 = 47.4% of stocks are trading above their respective 200DMAs
VIX = 27.7 (range from 21.2 to 31.6)
Short-term Trading Call: neutral
Commentary
Buyers failed their first post-oversold test. The S&P 500 (via SPDR S&P 500 (NYSE:SPY)) rallied just enough to peak over resistance at its 50-day moving average (DMA) but failed to hold there. The fade was accentuated by a rush of selling in the last 15 minutes of trading. Now the index is one follow-through day away from printing a very bearish pattern that would confirm 50DMA resistance. Only oversold conditions will stand as a buffer against that reading.
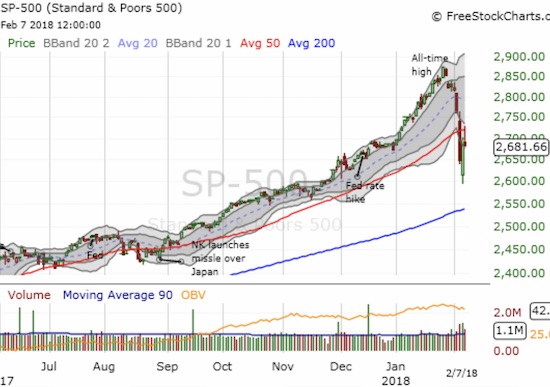
Sellers rejected the S&P 500 (SPY) at 50DMA resistance.
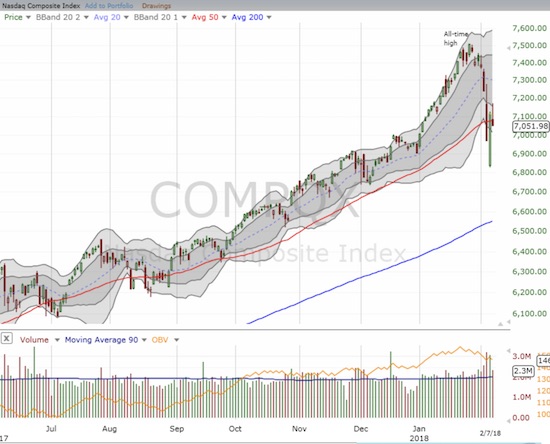
The NASDAQ looked like it had passed the test by leaping a good distance above its 50DMA. The confirmation of the previous day’s breakout was short-lived.
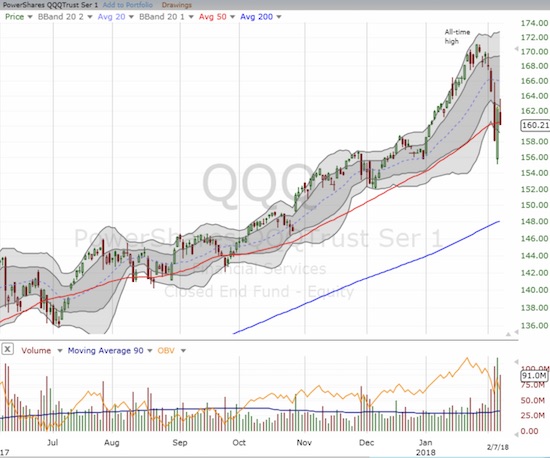
The PowerShares QQQ ETF (NASDAQ:QQQ) almost succeeded in holding 50DMA support.
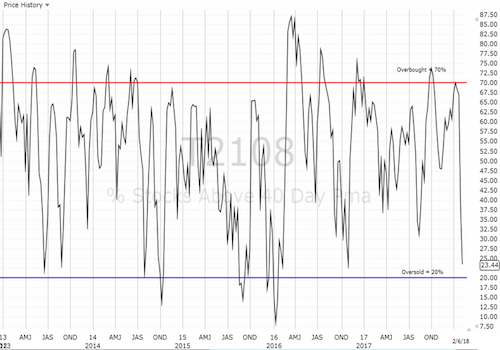
AT40 (T2108), the percentage of stocks trading above their respective 40DMAs, closed the day with a slight gain in a small hint of bullish divergence from the market. My favorite technical indicator survived the late selling to close at 24.1% and a marginal lift. If AT40 drops into oversold conditions again (below 20%), I will refresh the oversold trading rules I outlined during the 1-day oversold period. If the S&P 500 closes below Tuesday’s intraday low of 2593, I will assume the inevitability of a test of 200DMA support. Moreover, I will be even more inclined to fade rallies at 50DMA resistance. For today, I picked on BHP Billiton (LON:BLT) per the top in iron ore I described last week. I also added to my put options on Caterpillar (NYSE:CAT) which now serves as a hedge.
However, I could not help getting a head start on two bullish plays I expect to pay off by the end of next week. I bought a fresh call option on SPY that actually triggered AFTER the close of trading (it was a low ball limit order that I did not cancel at the close). I also bought a single put option on ProShares Ultra VIX Short-Term Futures (NYSE:UVXY). This mixed approach is a result of my neutral short-term trading call and preparation for the lingering potential for at least one more large outsized move in either direction.
At one point, the volatility index, the VIX, faded hard. It even dropped below Tuesday’s intraday low. After I saw UVXY reacting slowly, I bought that put option. Interestingly, the put option did not lose much value after the VIX rebounded to close at 27.7. I strongly suspect the market is bracing itself for more wide-ranging moves.
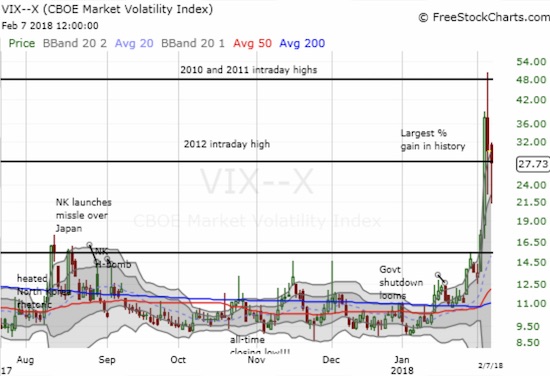
The volatility index fought off volatility faders and recovered well off its low of the day.
The U.S. dollar index (USD) is one of the notable changes facing the market. I concluded that the dollar stopped going down last week. That bottom received some validation by the day’s 0.8% spike in the dollar. Trend-following strategies that counted on the dollar to continue declining may be rapidly adjusting and helping to add to market volatility.
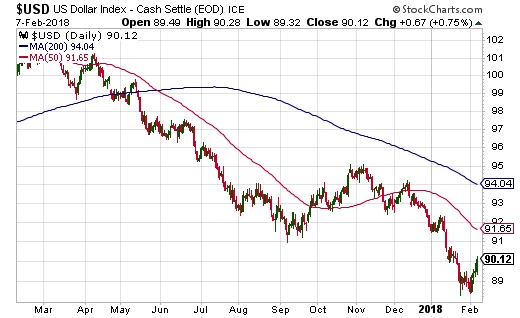
The U.S. dollar index (USD) spiked higher of its recent bottom. This move may have confirmed the dollar’s bottom with an exclamation point.
CHART REVIEWS
Snap (NYSE:SNAP)
On August 25, 2017, I claimed that SNAP finally bottomed…and I had nothing else to say about the stock until now.
From the presumed bottom, the stock pivoted widely around its 50DMA and delivered another disappointing earnings performance along the way. Sellers were unable to generate follow-through, and SNAP stopped selling off before retesting its low. THAT action provided a glimmer of fresh hope. That hope exploded into absolute amazement.
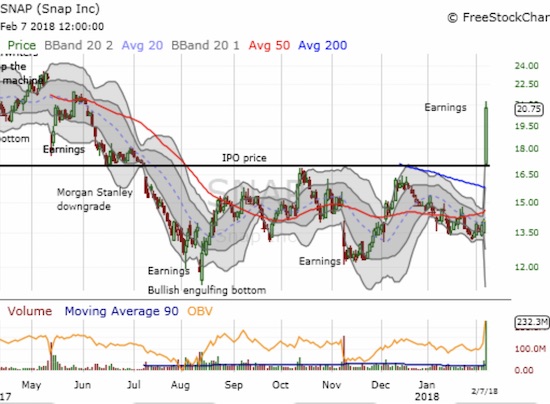
Snap (SNAP) gapped up above its IPO price and did not look back. It ended the post-earnings day with an eye-popping 47.0% gain.
SNAP’s post-earnings 47.0% gain came after the stock gapped above its IPO price. At first I considered switching from long to short. I hesitated because the options on SNAP seemed very “cheap” for a stock with such a huge gain amid a high volatility environment for the stock market. I rejected the idea of buying put options assuming this pricing indicated that the market did not expect much more volatility from the stock.
At $19 and then $19.50, I decided to sell a covered call with a $20 strike against part of the position with a limit order. The stock drifted slightly downward from there, and I rushed to take the market’s price. Shortly after that fill the stock started to rally yet again. With a 40%+ 1-day gain, I decided it made no sense to continue holding my entire position. I took profits on my uncovered shares, and I am fine if the market calls away the rest of my position at next week’s expiration. If my covered call expires worthless, I will consider selling another call option.
This kind of buying has likely drawn firm support at the $17 IPO price. No doubt there was a lot of short-covering. In August, 17.8% of SNAP’s float was sold short. As of Wednesday, that number is 30.4%.
Chipotle Mexican Grill (NYSE:CMG)
On the other side of the earnings ledger, CMG suffered a 10.6% post-earnings loss. I dropped this position just in time.
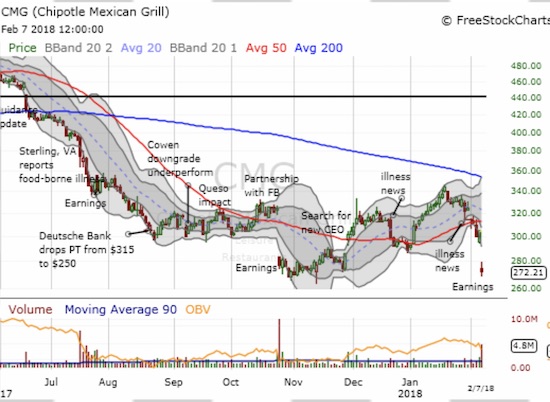
Chipotle Mexican Grill (CMG) gapped down and retested recent lows. Continued selling from here would be freshly bearish for the stock even with it stretched so far below its lower-Bollinger Band (BB).
— – —
“Above the 40” uses the percentage of stocks trading above their respective 40-day moving averages (DMAs) to assess the technical health of the stock market and to identify extremes in market sentiment that are likely to reverse. Abbreviated as AT40, Above the 40 is an alternative label for “T2108” which was created by Worden. Learn more about T2108 on my T2108 Resource Page. AT200, or T2107, measures the percentage of stocks trading above their respective 200DMAs.
Active AT40 (T2108) periods: Day #2 over 20%, Day #3 under 30%, Day #4 under 40%, Day #4 under 50%, Day #5 under 60%, Day #11 under 70%
Daily AT40 (T2108)
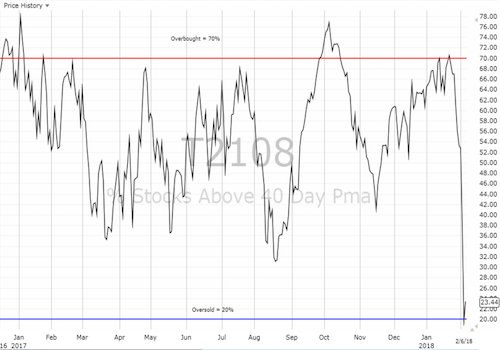
Black line: AT40 (T2108) (% measured on the right)
Red line: Overbought threshold (70%); Blue line: Oversold threshold (20%)
Weekly AT40 (T2108)
Be careful out there!
Full disclosure: long SNAP shares and short covered call, long SPY call, long UVXY put, long BHP puts, long CAT calls and puts
