Over the last couple of weeks, not a lot has changed. Market internals remain poor, and “trade war” rhetoric from the White House continues to worry the markets. It also certainly didn’t help the situation on Friday when President Trump decided to calm the markets by saying:
“I’m not saying there won’t be a little pain so we might lose a little of it (stock market gains) but we’re going to have a much stronger country when we’re finished, and that’s what I’m all about.’
That wasn’t the reassurance the market was looking for.
As I discussed in “A Simple Method Of Risk Management:”
“The market always ‘prices in’ events or issues it is aware of such as economic data, earnings estimate changes, and even geopolitical events. In other words, it isn’t the thing that markets are aware of, but the unexpected event which sends traders, and algorithms, rushing for the exits.”
What is missed by the White House is that “trade wars” are not economically beneficial. It hurts producers with higher input costs which impacts profits margins. It also translates into higher prices on goods and services for consumers without a commensurate increase in wages which are suppressed by producers to offset higher input costs. It’s a vicious spiral. Companies who trade internationally, which is a much larger percentage today than it was back in the 1980’s, are also hurt by higher prices which leads to reduced demand.
Setting aside the economic threat for a moment, and focusing solely on the stock market, the risk of an acceleration in the “trade war” is a negative impact to exceedingly lofty earnings expectations over the next two years. The chart below shows the revisions to estimates as of the past 4-months.
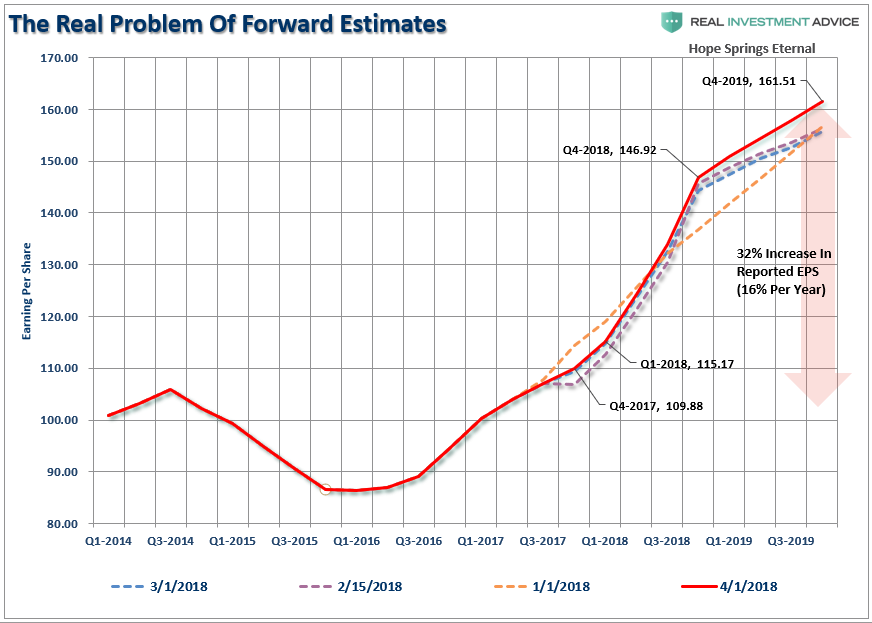
The market has already priced in much of this increase in earnings based on the recent tax-cut legislation. If those estimates start getting revised sharply lower, due to increased costs that can’t be passed along or by a stronger dollar, the negative revisions will weigh on asset prices.
What should be the most concerning about Trump’s statement, and as I addressed at length yesterday in the “Mind Numbing Spin Of Peter Navarro,” is that Trump is tied into a belief that is not supported by the economic “facts” at hand. This suggests he will continue down this path without regard to what the market is telling him.
The issue, of course, is that while Trump states we might have to put up with a “little pain”, it is the risk of a market decline that:
- Triggers margin calls on a near record level of margin debt.
- Weighs on asset prices enough to trigger a credit issue in the high-yield market
- Market decline creates a “pension run”
- Or a combination of any or all of the above.
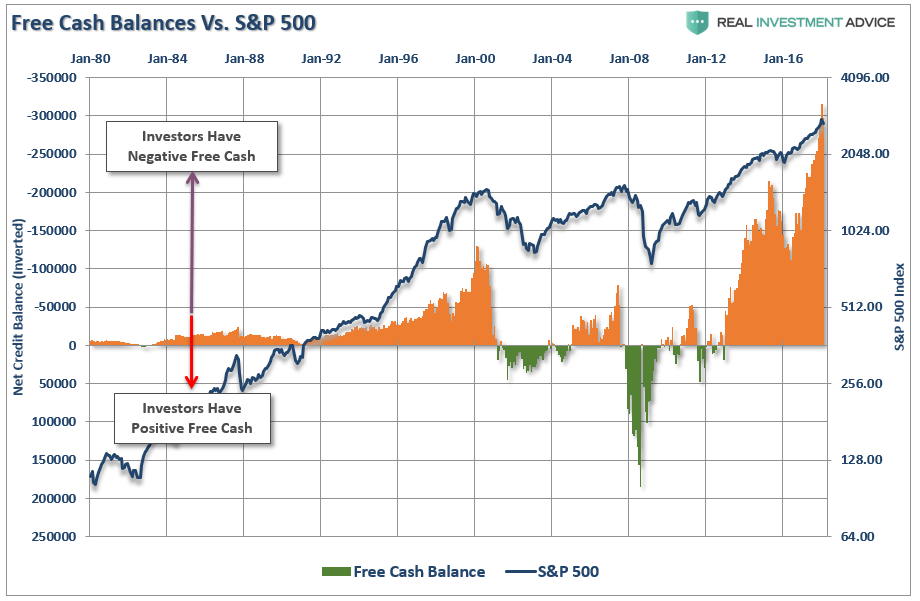
In other words, a “little pain” could quickly turn into an “agonizing amputation” if Trump isn’t exceedingly careful.
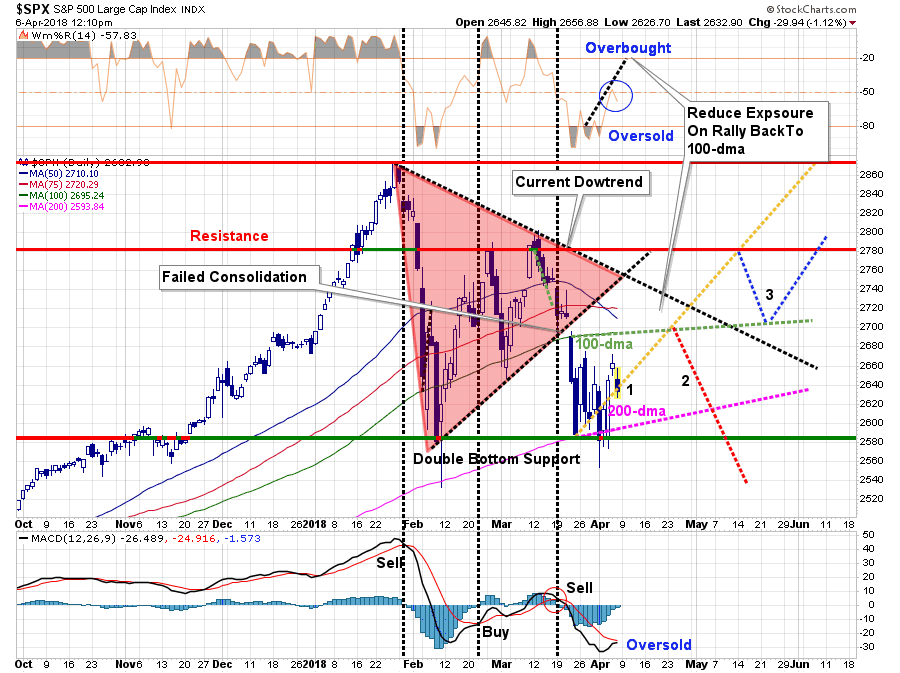
But with that said, the market has, so far, hung on to its support at the 200-dma as shown below.
More importantly, we continue to trace out the “reflexive rally” path I laid out previously (Option 1). As I stated last week:
“However, my guess is we are not likely done with this correctionary process as of yet. It is this pickup in volatility where the majority of emotional, or behavioral, mistakes are made.
From a very short-term perspective the backdrop has improved to support a continued reflexive rally next week:
- The market remains oversold providing fuel for a relief rally.
- Option 1, noted above, continues to be the preferred path for a rally back to the 100-dma.
- Double bottom support at the 200-dma provides a bullish backdrop.
With this setup, the possibility of more constructive action next week has risen.”
That “more constructive action” statement, while true, certainly left a lot to be desired.
The problem that now arises that the majority of the short-term oversold condition, which supported the idea of a “reflexive rally,” has largely been exhausted. While the improvement short-term suggests a further rally into next week, the 100-dma, as a target to further reduce equity and risk related exposure, is becoming more tentative.
Of course, there are a lot of things that could go wrong as well, so having a plan to react quickly remains key.
As I stated last week, we currently are overweight cash in portfolios currently, but have NOT made our next adjustment lower as of yet. This is because, as noted above, our target levels for a retracement have not been fulfilled, nor has support been broken.
For now, we want to give the bulls the benefit of the doubt, but that “bit of rope” is awfully frayed at this juncture. If the market hits our target zone or breaks support, as shown below, we will reduce portfolio “risk” further.
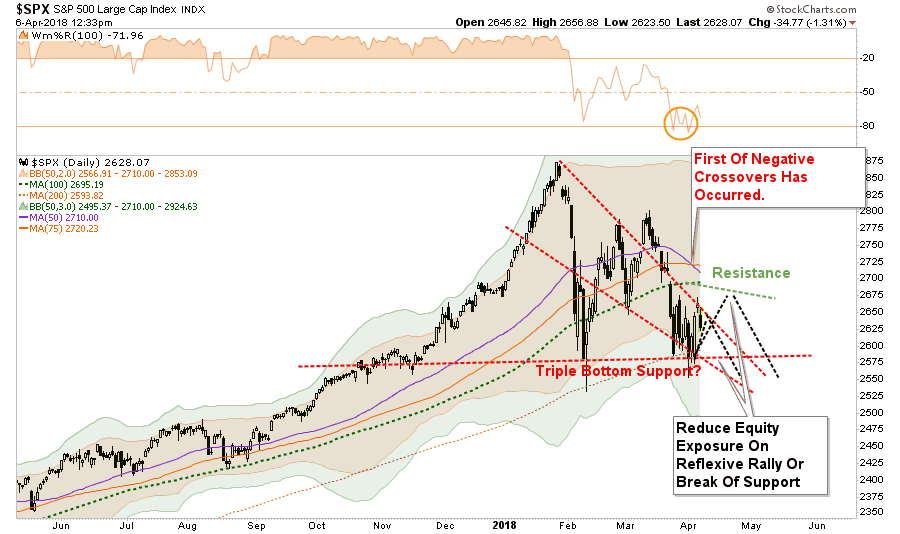
My best guess, at the moment, is that “someone” may well try and talk “the Donald” off his aggressive posture over the weekend. If the markets get some “relief,” a rally to resistance is likely.
Do not be overconfident and assume markets have corrected themselves and that we are back into a “ripping bullish trend.” There is a larger case being built for further corrective action ahead.
Currently, the “bulls are hanging on by a thread.”
There is little risk in reducing equity exposure. If you do reduce risk, and the market rallies, you can always redeploy your“saved” capital very quickly. However, it is an entirely different, and “much” more difficult, matter to “recoup” lost capital.
There is a reason it is called “risk versus reward.”
Just A Correction?
I am not big on comparing the current market to past ones. I often see charts of why “now looks like 1929,” or “this is what happened just before the crash of 1987.” While price patterns can often align, the drivers of the markets are entirely different. The backdrop of the market today versus 1929, 1987 or 2007 are markedly different. However, that doesn’t mean the current bull market won’t end just as badly, just the timing and the catalyst will be different. They always are.
So, with that said, let me do exactly what I said I don’t like doing.
The point of this exercise, however, is not to suggest the current market is set up for a major “mean reverting” correction, but rather to try and understand the difference between a “correction within an ongoing bull market” or the “beginning of a major decline.”
Bull markets have a life to them. I quoted Sir John Templeton is “The Death Of Bull Markets”
“Bull markets are born on pessimism, grow on skepticism, and die on euphoria.”
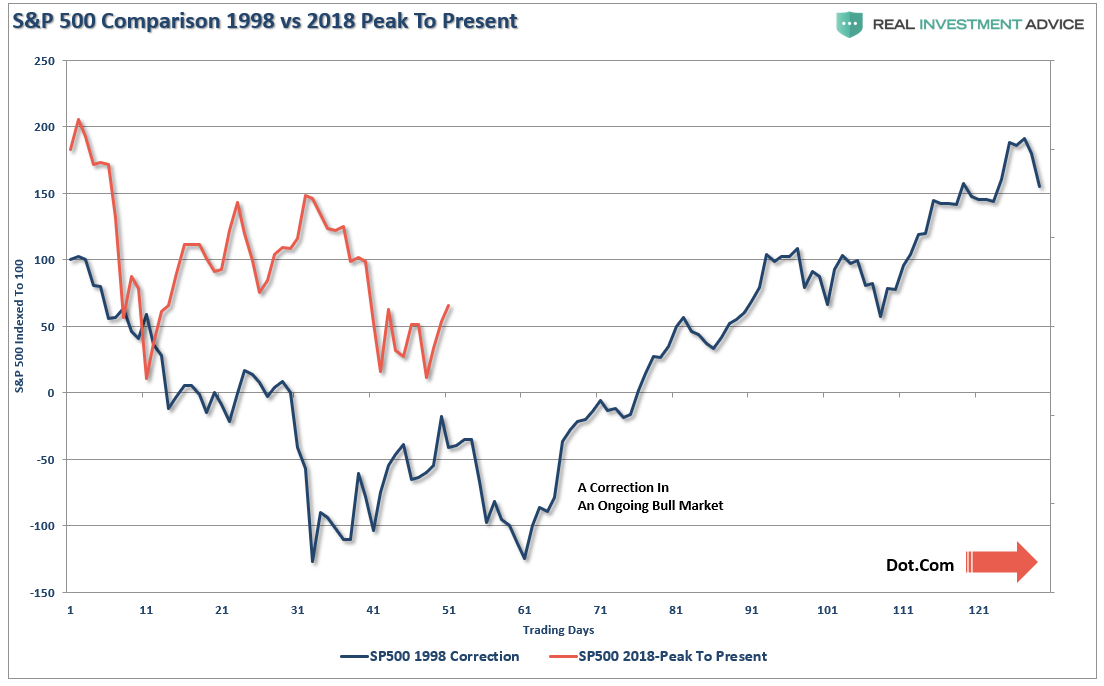
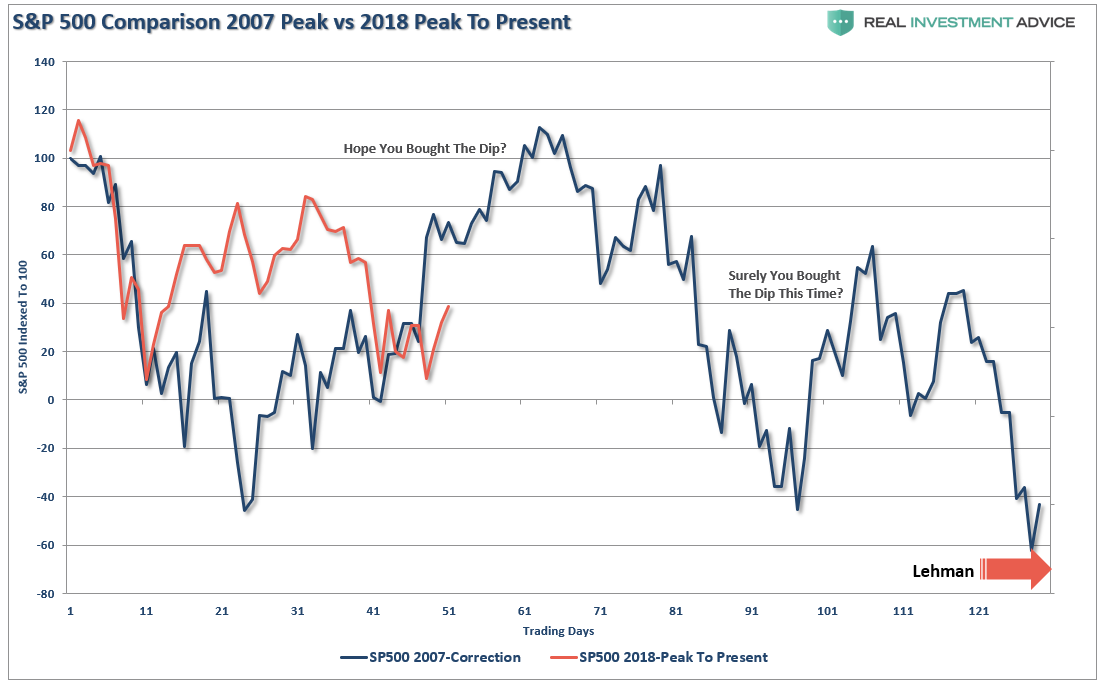
You can see that rhythm in the chart below. Interestingly, note the peak of the current market coincided exactly with the peak of the market in 2000.
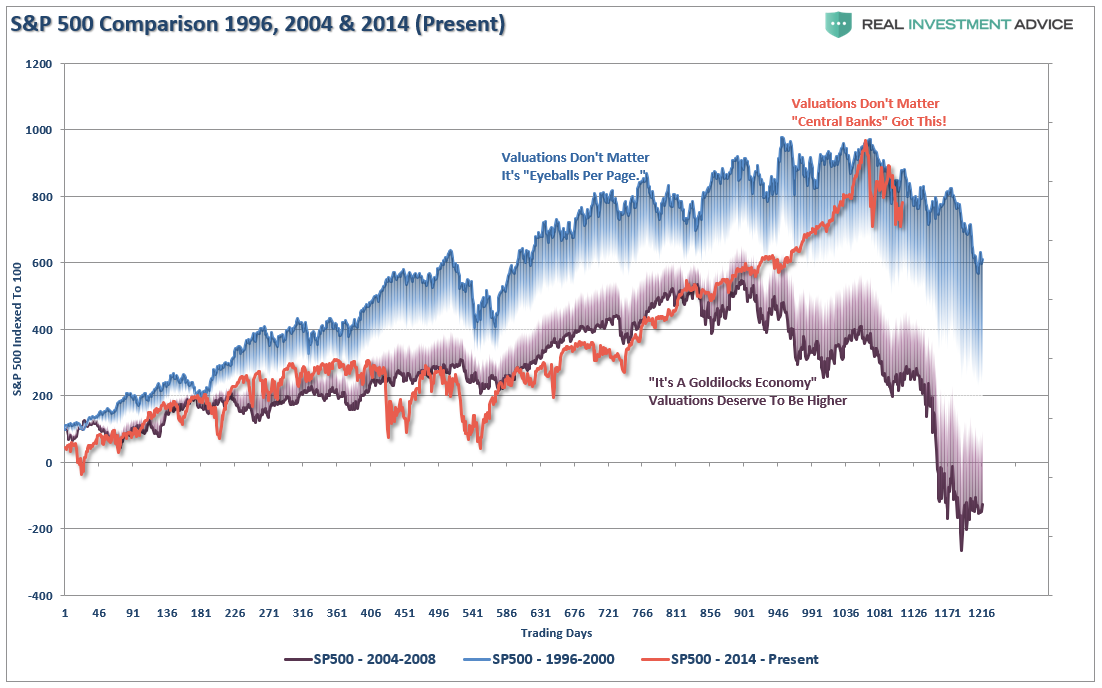
While the comparison to the 2000 bull market peak is certainly alarming, there have also been periods in history where similar corrections have occurred only to resume the previous bullish trend afterwards.
For example, in 1998 as the financial markets came to grips with the fallout of “Long-Term Capital Management,” the market set aside those worries to rocket higher for another two years.
Of course, that was the final leg of the “Dot.com” bubble before it’s peak in 2000. The difference was that in 1998 the Fed was just getting ready to start their “inflationary witch hunt,” when there wasn’t a problem, and start hiking rates. In 2000, the rate hikes broke the market.
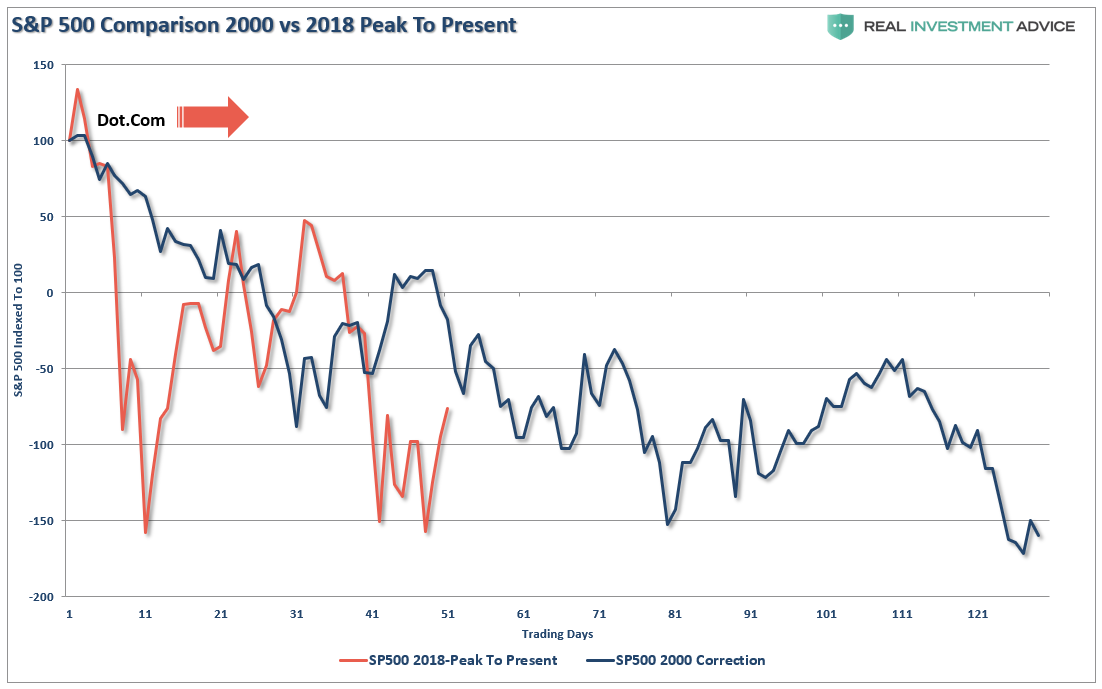
Similarly, the early correction in 2007 recovered as investors pushed the markets to “new highs” under then Chairman Bernanke’s urging that we were in a “Goldilocks” economy and “sub-prime mortgages were contained.”
Of course, neither was the case. The Fed was already well into a rate-hiking campaign to quell the “inflation monster” that once again actually didn’t exist. Once rates pricked the debt bubble, the “financial crisis” was set in motion. However, when Lehman was forced into bankruptcy, the market seized. (The subsequent price decline triggered “margin calls” fueling the collapse. See margin chart above)
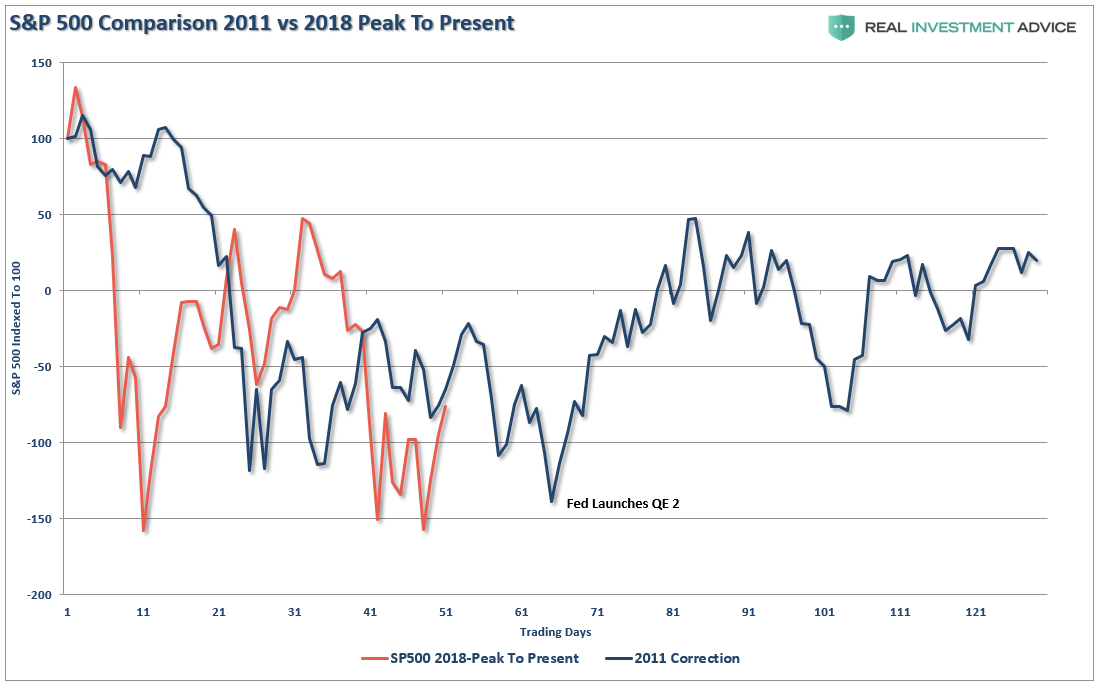
The difference in 2011, which saw a similar correction as to the one we are living through currently, was the Fed was NOT hiking rates but rather suppressing rates through QE programs. There is a reasonable argument that if Bernanke had not lauched QE2, the correction might have been substantially deeper.
In 2015, the market plunged as Fed Chair Janet Yellen brought QE3 to its conclusion and started hiking interest rates for the first time in 9-years. Again, this correction would likely have been substantially deeper as the Eurozone faced “Brexit” which sent through the market. The well-timed phone calls to the Bank of England and the European Central Bank by then Fed Chairman Yellen, to take over liquidity operations stemmed the decline. Also as opposed to 2000 and 2007, the Fed had only just started its rate hiking campaign.
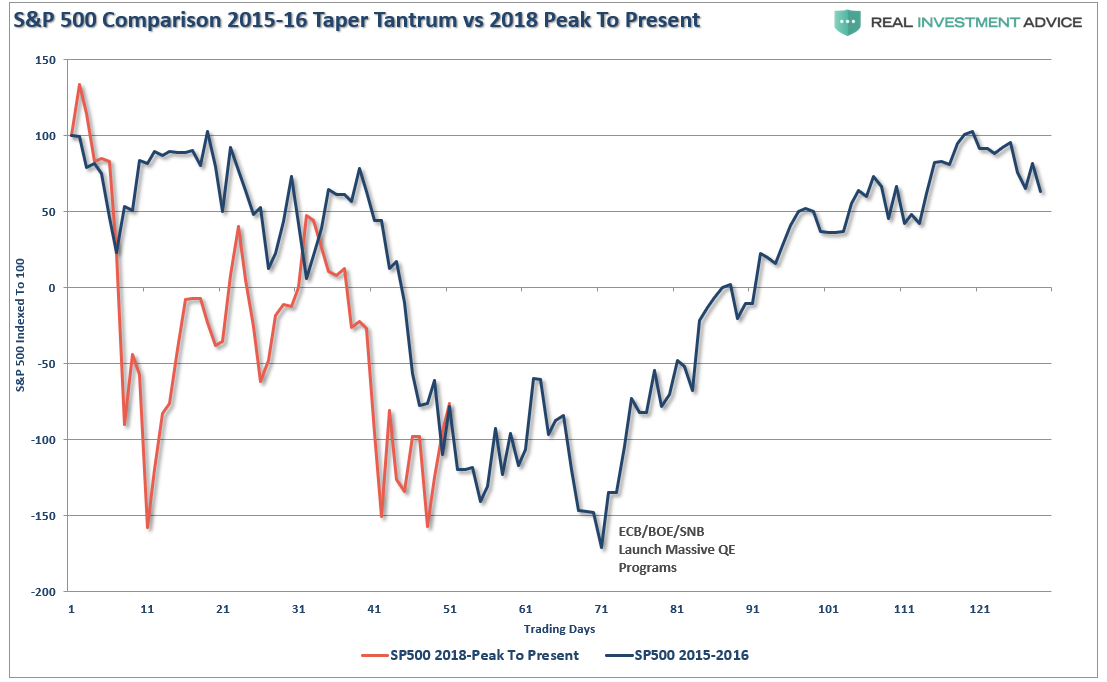
The current market correction is more aligned with the end of a market cycle versus the beginning of one. The market is facing numerous headwinds that did not exist in 2011 or 2015.
- The Federal Reserve continues to hike interest rates on the short-end pressuring the yield-curve flatter.
- The ECB and other Central Banks are tapering their liquidity operations.
- The global economic impetus has begun to wane.
- The boost to the U.S. economy from 3-hurricanes and 2-major wildfires has started to fade.
- The Federal Reserve has begun draining liquidity from the system by reducing their balance sheet reinvestments.
- The current Administration is engaging in a “trade war” which potentially impacts various aspects of the economy.
- Valuations remain extremely extended
- Despite the recent turmoil, high-yield spreads remain very compressed which suggests that “fear” has not entered back into the market yet.
- Interest rates are rising in the areas of the economy that impact consumption the most.
- Delinquencies are rising
- Loan demand is falling
You get the idea. But let me add this nugget from my friend Doug Kass:
“Hastily crafted economic policy by the current Administration will likely damage CEO confidence, freeze business spending and destroy shareholder wealth.”
And if that happens….well, that is when the “delightfully plump non-gender specific person begins singing.” (To be politically correct.)
This ain’t the beginning of a bull market cycle.
“I fear that an untethered President is conflating politics with economic policy. The latter is being hastily crafted without deep analysis and recognition that we live in a world that is flat, networked and interconnected more than any time in history. (If I can paraphrase Vizzini in the movie, The Princess Bride, the President has fallen victim to one of the classic blunders, the most famous of which is never get involved in a trade war in Asia).” – Doug Kass
Let’s see what happens next week.
Market and Sector Analysis
Data Analysis Of The Market and Sectors For Traders
S&P 500 Tear Sheet
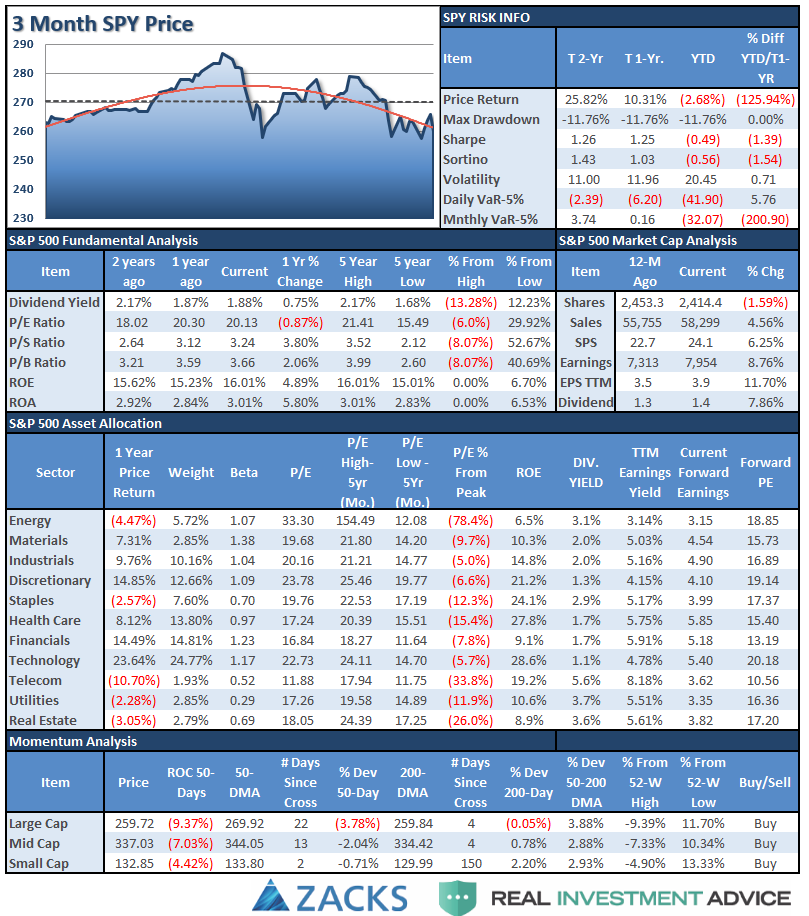
Performance Analysis
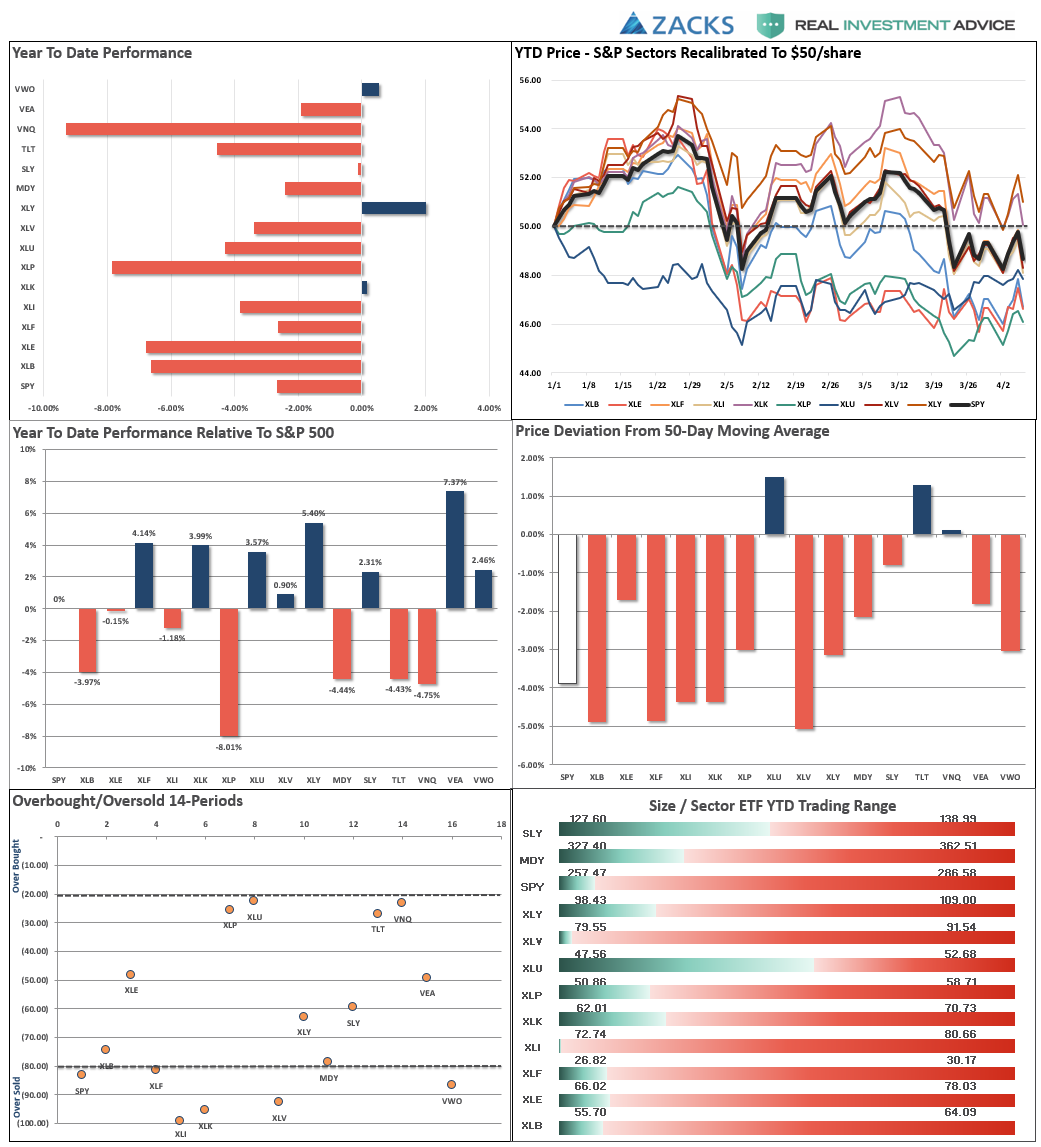
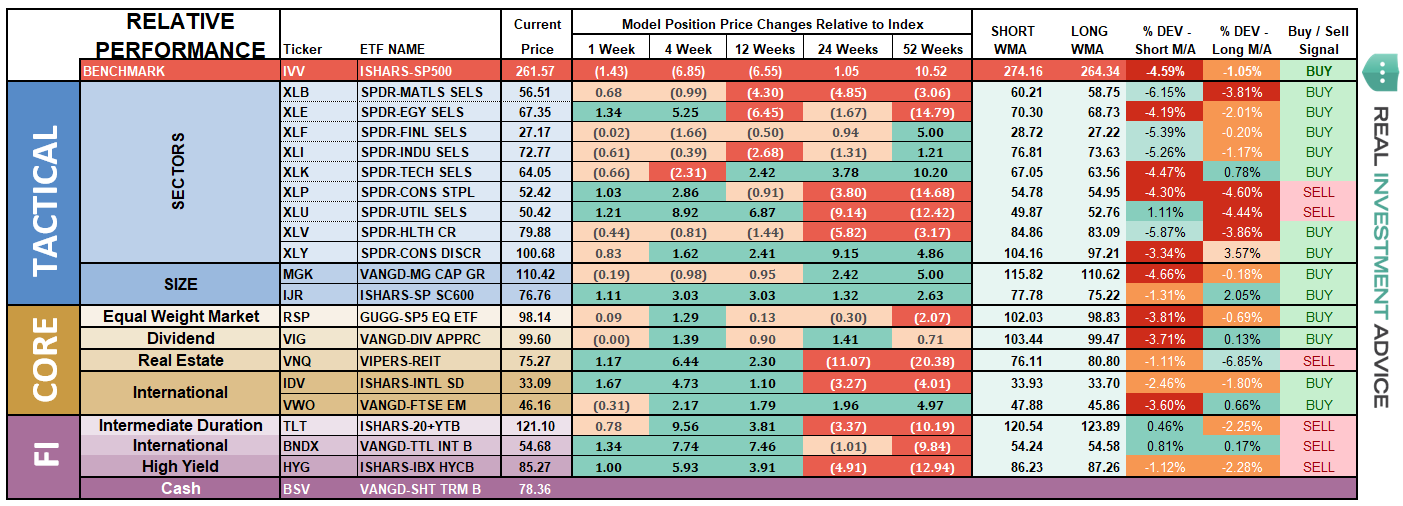
ETF Model Relative Performance Analysis
Sector and Market Analysis:
With the “sell signal” firmly in place on a short-term basis, the selling pressure has continued to suppress a rally in the market. Well, that and the ongoing imaginary “trade war” between Trump and China. The expected rally last week ended abruptly on Friday but there was some improvement made.
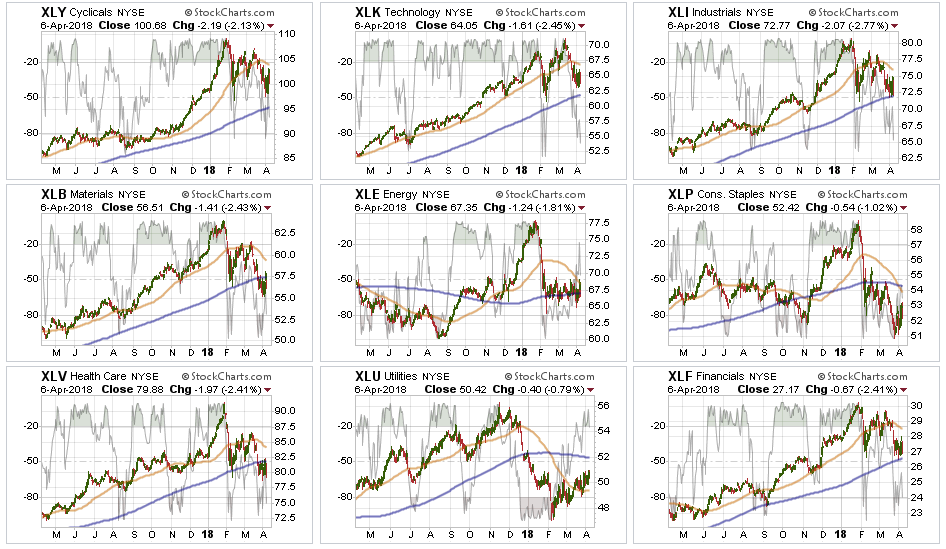
Discretionary, Technology, Industrials, and Financials all of these sectors have continued to remain below their respective 50-dma’s. Furthermore, these sectors, while improving and holding relative support levels, are NOT oversold currently which provides enough room for a test of their respective 200-dma’s over the next couple of weeks. As I noted two weeks ago, it was a reasonable idea to take profits and reduce weightings accordingly.
Health Care, Materials, and Energy – we were stopped out of our small additional Energy trade with the previous break below the 200-dma, and continue to recommend under-weighting the sector for now. The push higher in oil prices looks to have ended as the “hurricane” related boost fades. We also closed out our
Staples– our stop level was triggered on Staples and we will be eliminating exposure to the sector on this rally. The sector triggered a moving average crossover which will further pressure prices lower.
Utilities have significantly picked up performance in recent weeks and have broken back above the 50-dma. We are not recommending adding to the position yet as the moving-average crossover remains negative. However, we continue to hold our current weights as a hedge against the broader market. Stops have been moved up to the 50-dma.
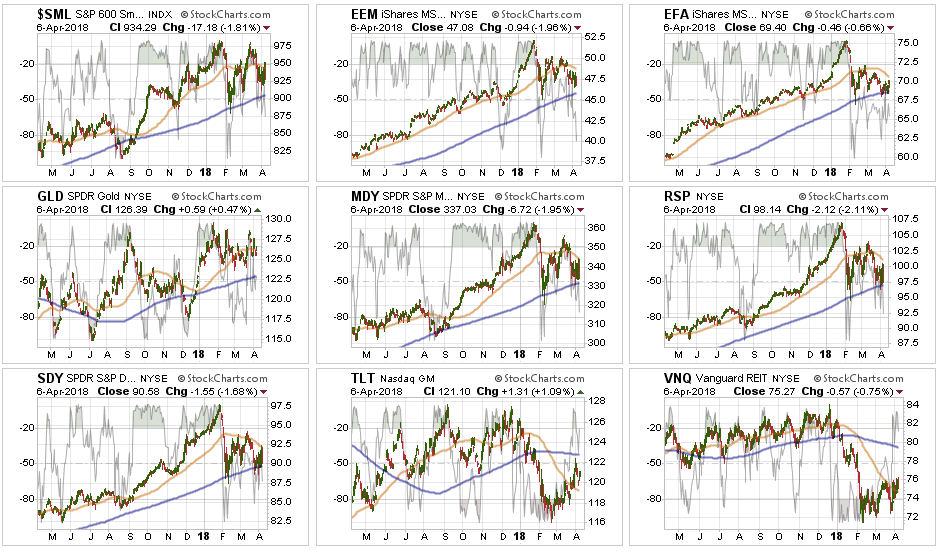
Small Cap, Mid Cap, Emerging Markets, International, Equal Weight, and Dividend indices all broke back down through their 50-dma with international stocks testing its 200-dma. Three weeks ago, we removed international and emerging market exposure due to the likely impact to economic growth from “tariffs” on those markets. That reduction helped hedge risk this past week. Dividends and Equal weight continue to hold their 200-dma and performed better than the S&P index as a whole as money rotated to Utilities in the “flight to safety” rotation.
Gold continues its volatile back-and-forth trade but remains confined to a downtrend currently. As of this past week, Gold failed a test of recent highs. We currently do not have exposure togold, but if you are already long the metal, we previously recommended that while the backdrop overall remains bullish, the correctional phase continues so taking profits on rallies remains prudent.
Bonds and REITs over the last three of weeks, these two sectors looked to have bottomed and initiated early “buy” signals. Hold positions for now as interest rates have started to recognize the economic weakness that has shown up in the data as of late. Our heavier cash position and exposure to Bonds, REITs, Utilities have hedged overall market risk and volatility recently.
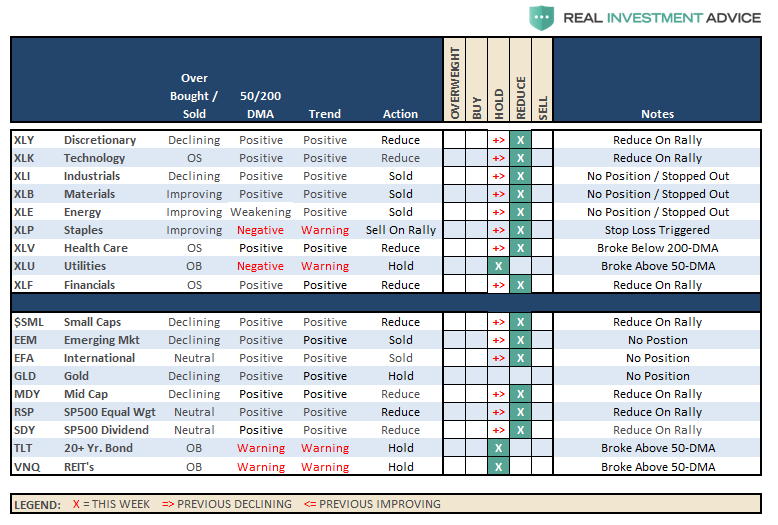
The table below shows thoughts on specific actions related to the current market environment.
(These are not recommendations or solicitations to take any action. This is for informational purposes only related to market extremes and contrarian positioning within portfolios. Use at your own risk and peril.)
Portfolio/Client Update:
As discussed in this week’s missive, there is still a reasonable expectation for a rally on any relief from the “trade war rhetoric.” While we continue to honor the current “bullish trend,” we are also well aware of the rising risks and continue to look for an opportunity to derisk and re-hedge portfolios in the near future. As noted above:
“Our heavier cash position and exposure to Bonds, REITs, Utilities have hedged overall market risk and volatility recently.”
If the market repairs all of the technical damage and re-establishes the previous bullish trend, we will reallocate accordingly and increase equity exposure back to target levels. Our bigger concern, currently, remains the relative risk to capital if the 9-year old bull market. If the current correction expands into a more meaningful reversionary process, we will become much more aggressively risk adverse. As I noted in the main body of this missive, there is plenty of evidence to support the latter case.
We will continue giving the market a bit more “running room” this coming week, but we are “tightening up on the reigns” in terms of overall risk tolerance. As always, we prefer the market to “tell us” what it wants to do versus us “guessing” at it. “Guessing” generally never works out as well as planned.
It is crucially important the market maintains support at current levels and rallies next week. After having reduced exposure to “tariff” related areas a couple of weeks ago (materials, emerging and international markets), and again, we will use any rally in the next week or so to further reduce equity risk exposure in portfolios.
We remain keenly aware of the intermediate “sell signal“ which has now been “confirmed” by the recent market breakdown. We will continue to take actions to hedge risks and protect capital until those signals are reversed.

