Since my last post mainly focused on global economic trends, and which continue to show signs of slowing, it is interesting to note that I have not commented on financial markets in about two months now. Recapping the post written in early May, I wrote that:
“The most disappointing period of stock market performance is May to October, while outperformance occurs from November to April. I’m sure we have all heard the famous “Sell In May and Go Away” quote. …the oversold conditions and extremely pessimistic sentiment in February led to a sharp [stock market] rally over the last 10 weeks. With seasonality now turning negative, I would advise my readers to exercise caution. Vertical rallies, such as the one we recently witnessed in the S&P 500, are not sustainable on annualised basis. Certain market pundits have advised buying the recent dip, but we would argue… that the market isn’t oversold just yet.
Advance decline line and up down volume averaged over 10 trading days haven’t fallen enough to signal oversold conditions; percentage of S&P stocks trading above their 50 day moving average hasn’t even fallen below neutral levels yet; percentage of S&P stocks trading at 20 day new lows hasn’t spiked to at least 50% of the index components; NYSE 52 week new highs versus 52 week new lows ratio still remains elevated and not even close to neutral levels; and NYSE Mcclellan Oscillator is close to becoming oversold, but we would prefer lower readings of around -80.”
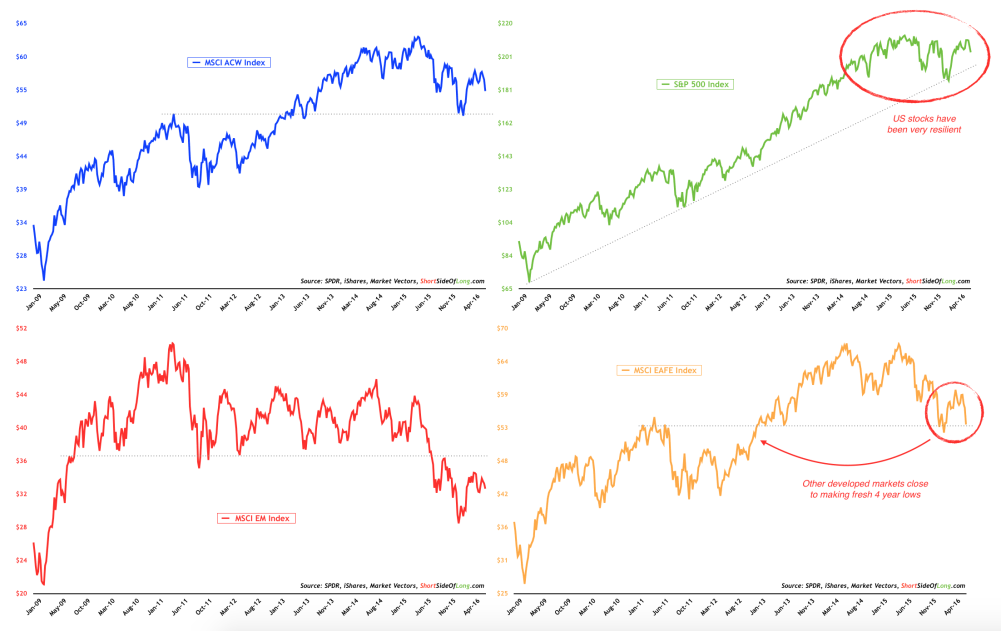
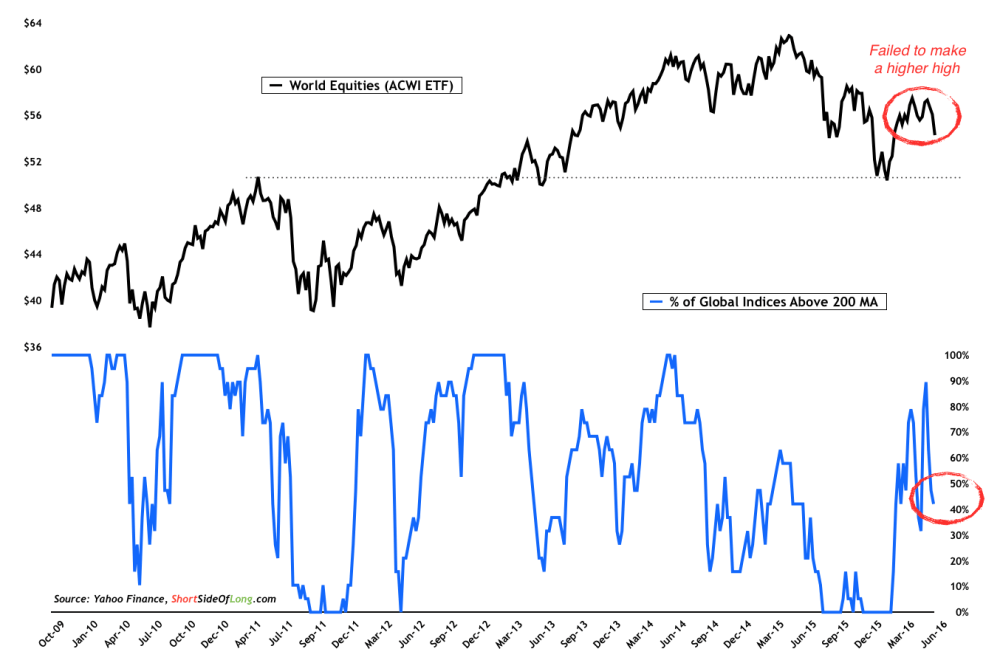
A lot of technical aspects there, but in summary I held a cautious view which proved wise, with global equities (via iShares MSCI ACWI (NASDAQ:ACWI)) as a whole continuing to struggle.
We should not be blaming last week's “Brexit”, nor think of it as the cause for a sell-off. Instead, it's just yet another catalyst in a downtrend that started in May 2015, in what seems to be a slow but steady bear market.
The truth is, if it wasn’t for United States’ resilience, the MSCI All-Country World Equity Index would probably be close to making new 4 year lows, similar to the MSCI EAFE Index seen in orange above. After the panic on Friday, now less than 50% of global indices are trading above their respective 200 day moving averages.
While US indices such as the S&P 500 are on the list, some of the other major indices include: Australia, Canada, Brazil and Russia. Can we point out a theme here?
All of these countries are commodity producers and exporters, benefiting from a rebound in natural resources this year. These were some of the most hated markets coming into 2016, and yet they are showing a lot more resilience compared to Eurozone markets.
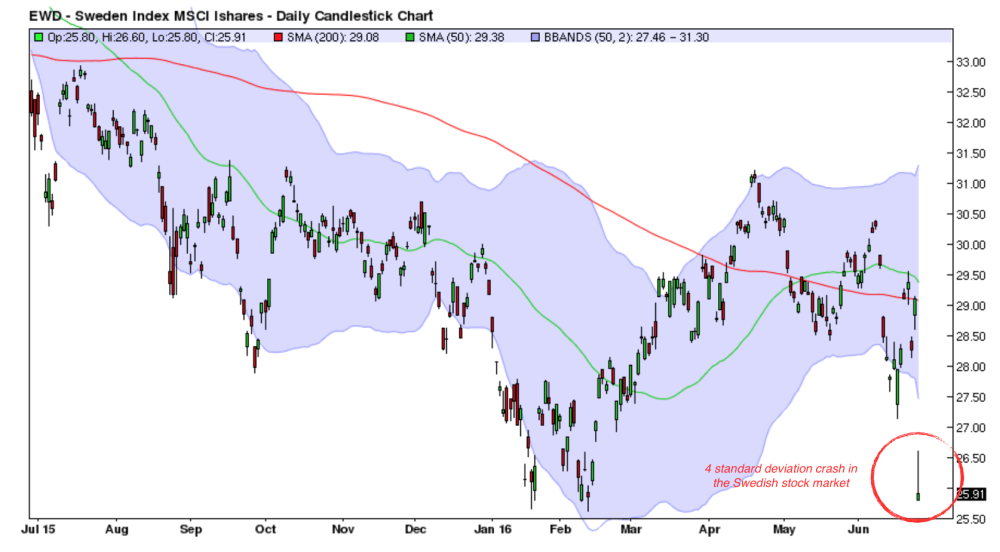
While we witnessed a dramatic sell-off in EU shares on Brexit’s Black Friday—with UK and Swedish markets registering moves that were around 4 standard deviations from the mean—it is important to note that the bear market in this region actually started a long time ago (when priced in US dollars).
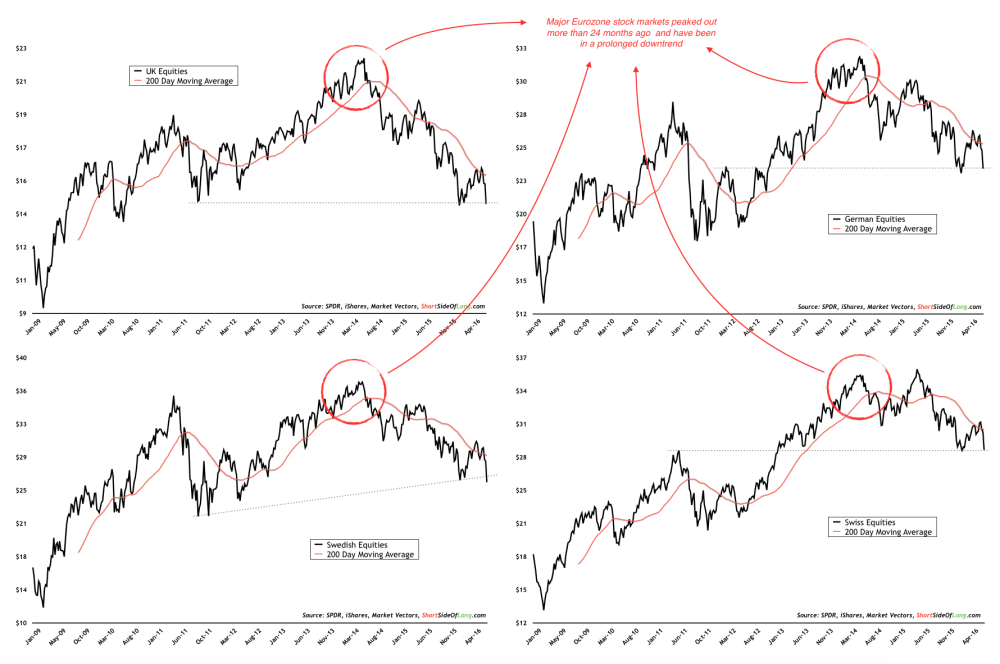
European equities were the favourite investment destination for the majority of global fund managers, all of whom believed that the ECB’s monetary policy measures, such as QE and negative rates, will benefit their trades. Not only did these policy measures (better yet, let's call them mistakes) not stimulate the economy, they actually also failed to goose asset prices.
If we observe the chart above, we notice that all four major equity markets (UK, Germany, Sweden and Switzerland) basically peaked out in the middle of 2014. Moreover, while we have short term oversold conditions from which stock markets could bounce for a week or so, there is still no evidence at this point that the primary downtrend in European shares is showing signs of reversing.
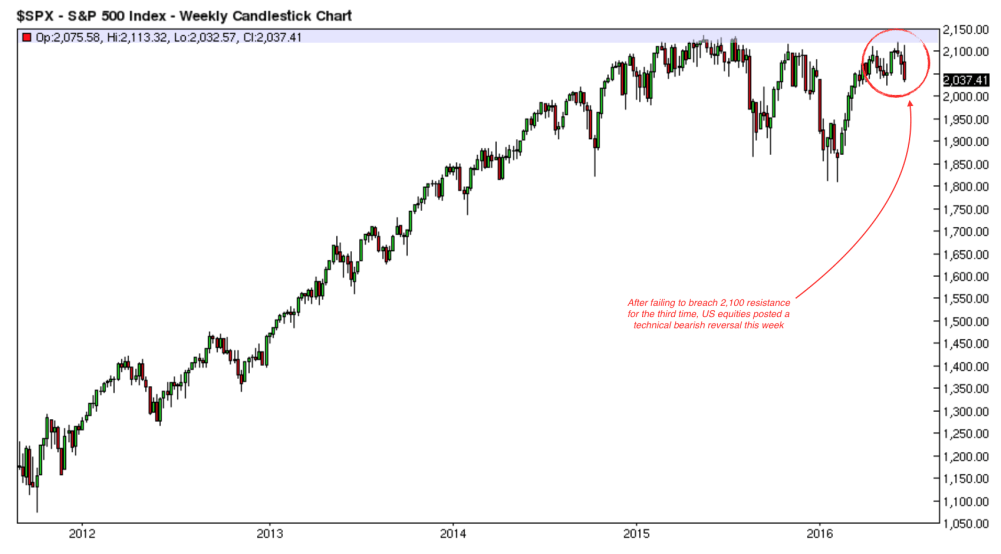
I would urge readers to pay close attention to the following paragraph, in case they hold investments in S&P 500 and related shares. On the topic of US resilience, what has me worried is an ugly technical reversal candle that occurred right at the resistance. A decent short term support, as well as the 200 day moving average, are found around 2020 on this closely watched index. A breach of these levels, could signal further downside.
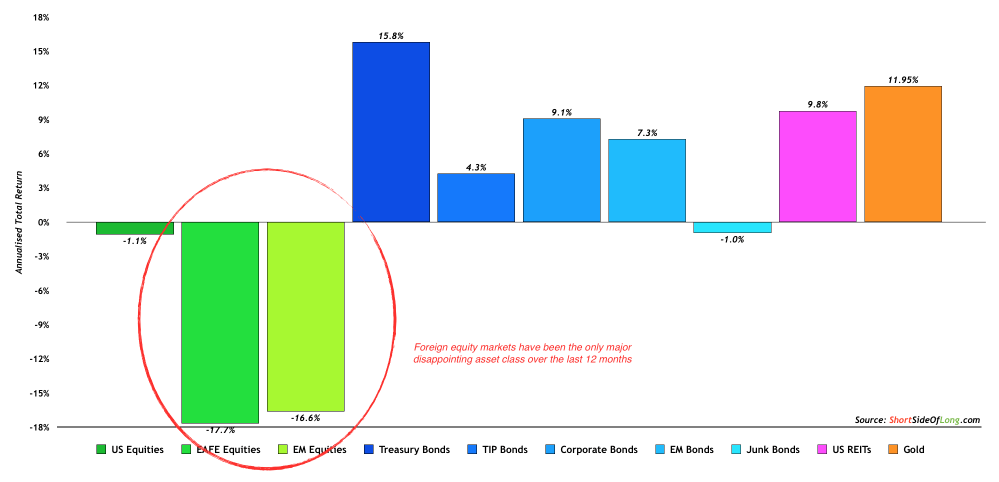
Reading all of the above, one would get a sense that I am quite pessimistic and that being an investor has been rather unforgiving of late. However, that cannot be further from the truth.
As we can clearly see in the chart above, over the last 12 months, the majority of asset classes have performed rather wonderfully. It only seems like a scary year because global equities went through a mini crash in January and February on China “hard landing” fears, which was followed up this week with the “Brexit” Black Friday crash.
The fact of the matter is that diversification, an investment strategy that I am very keen on, has been a wonderful tool that not only protected investors' capital, but is also making them money. Diversified investors would have benefited enormously from holding a variety of assets including commercial real estate (REITs), gold, DM government and DM corporate bonds, EM government and EM corporate bonds and Inflation linked bonds.
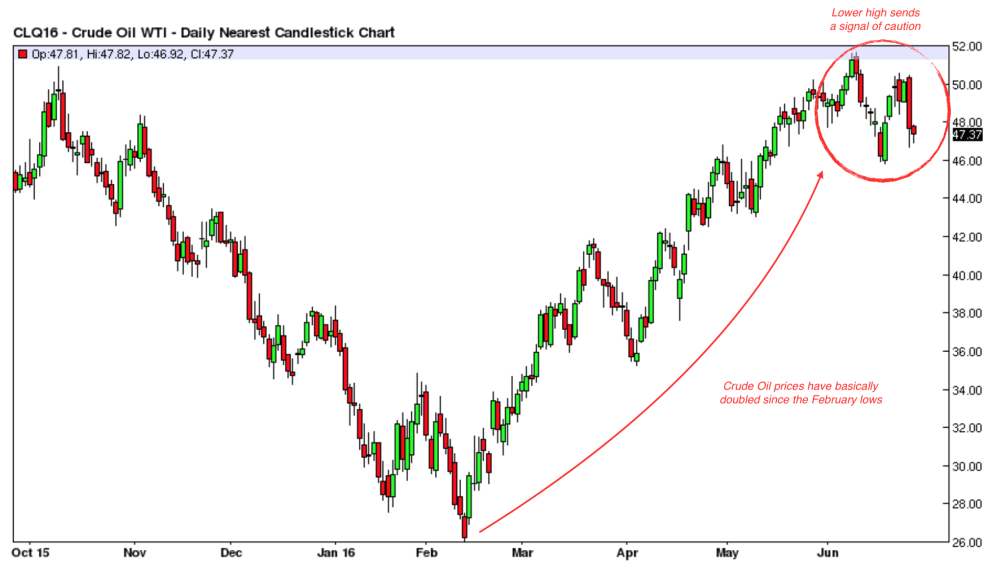
Even commodities, the most hated asset class coming into 2016, has been on a tear recently. Crude oil basically double from the February lows, in what has been one of the strongest and sharpest rallies since the Gulf War.
One development that has inflationists scratching their heads is the collapse of global bond rates, despite the fact that inflationary assets such as gold and crude oil are going through monster rallies. Let us recap what I wrote in mid April regarding the Treasury bond market (at the time, the U.S. 10-Year yield was at 1.75% compared to 1.58% right now):
“While positioning towards the debt markets is not that extreme, there are other sentiment gauges arguing that Treasury yields could rise somewhat from here. Firstly, small speculators positioning in the futures market shows dumb money is chasing Treasuries with an expectation of lower yields. Secondly, Mark Hulbert’s Bond Newsletter Sentiment Index (click here to see the chart) shows record bullish recommendations by various advisors and newsletter writers. Thirdly, number of shares outstanding on various Treasury ETFs has spiked in recent weeks (click here for the chart, thanks to Tom McClellan). Finally, according to ICI, fund inflows towards government bonds have been very elevated for weeks.
Putting it all together, one can see that there is room for unwinding of positions in the Treasury bond market. We have been long for a few months now and have recently changed our duration towards very short term Treasuries and Corporate grade bonds, as we expect a correction. Having said that, Treasuries still remain attractive for three reasons: 1) relative to rest of the developed world, Treasuries look attractive and could be considered high yielding sovereigns with only Australia & New Zealand paying you more; 2) we still continue to favour assets priced in US Dollars as we see the greenback resume its bull market once the current correction runs its course; and 3) we think that longer duration Treasury yields could eventually break down from the technical consolidation patterns.”
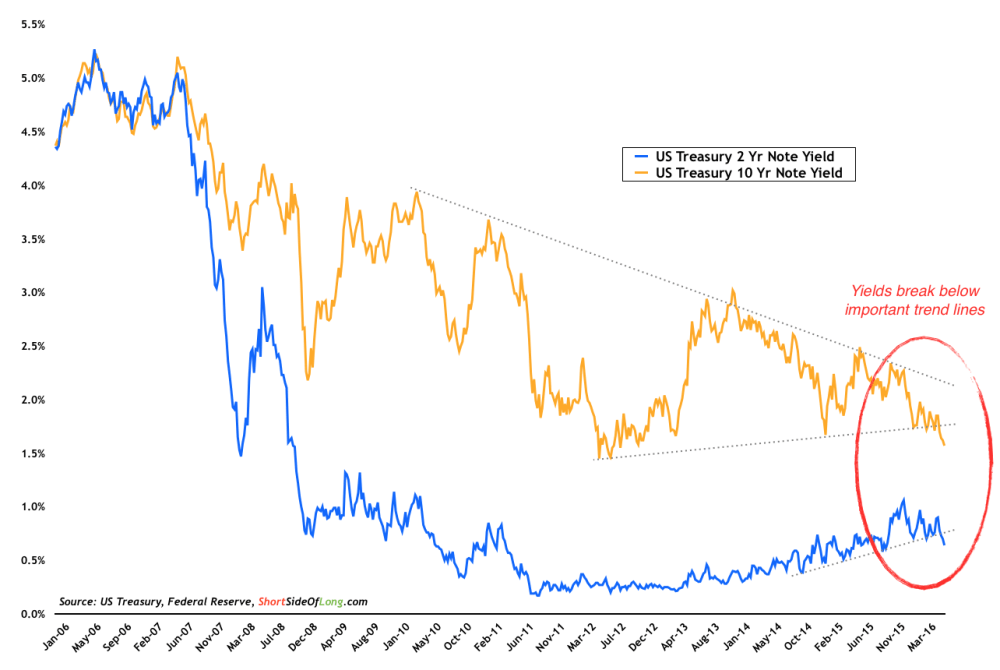
The correction in the bond market came in the form of a sideways consolidation instead of a sharp pullback, which was further proof of strong demand for Treasuries. Eventually, yields broke down from the triangle pattern we discussed a few months ago. The Treasury 10-Year Note yield dropped to new 52 week lows, while the 20-Year Bond yield closed a new lows. This overall movement is an anchor dragging the overall bond rates lower and therefore bond prices higher.
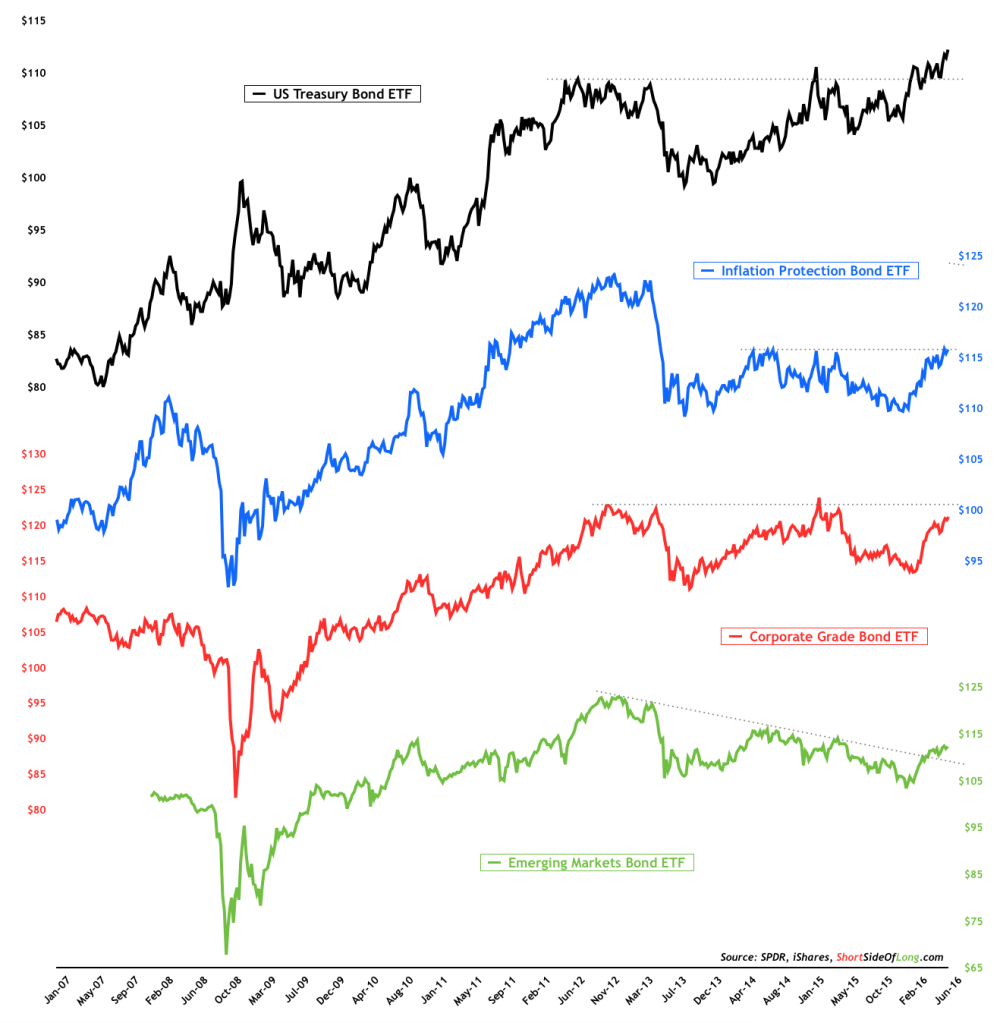
As already shown above, a truly diversified global portfolio would have benefited not only from holding Treasuries, but also other sections of the bond market such as investment grade corporates and emerging market debt.
The reason deflationary assets such as bonds are benefiting is also the same reason that inflationary assets such as commodities are benefiting: re-pricing of the Federal Reserve's inability to hike short term interest rates. When Janet Yellen hiked the Fed Funds rate from 0.25% to 0.50% in December of 2015, she also made a statement that through 2016 her committee has the desire to hike rates up to 4 times. Look at the chart above, I do not find it a coincidence that the overall bond market bottomed in early 2016, as did commodities including gold (chart below).
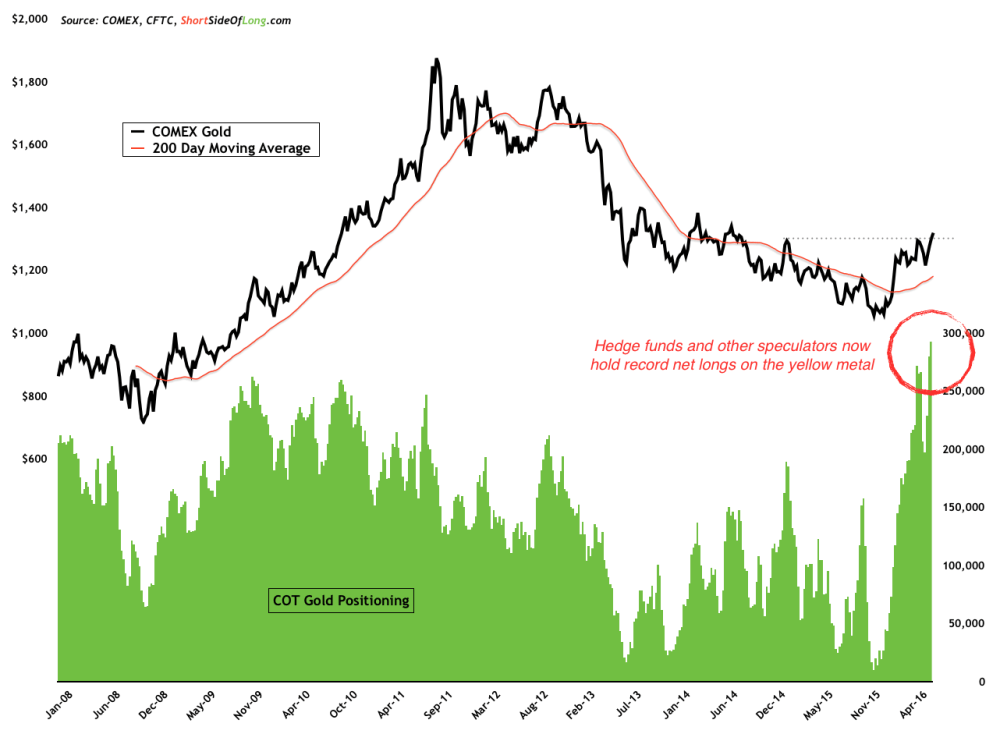
To some readers all of this will seem counter-intuitive, where markets bottom on bad news and top on good news. With that in mind, it is my belief that safe-haven assets, which have been rallying for the majority of the year already, will correct as soon as the Federal Reserve and other central banks turn yet more dovish. With bullish positioning and overly optimistic sentiment now tilted in favor of Treasury bonds, corporate bonds, Japanese yen and gold, it just further increases that probability.
In summary, I would advise readers to remain well diversified throughout this volatile period. This means not just geographically, but also with variety of assets including stocks, bonds, commodities, precious metals and real estate.
The problem exists with some of these safe havens being rather overbought and prone to a significant pullback. This is even more true if and when policy makers intervene to shore up panicked investors post the Brexit vote.
Short term traders should pay close attention to the S&P 500’s critical support level around 2020, which if breached could signal the continuation of the “risk-off” trade. On the other hand, another sign of resilience by US equities right here will surely signal that new all-time highs lay ahead.
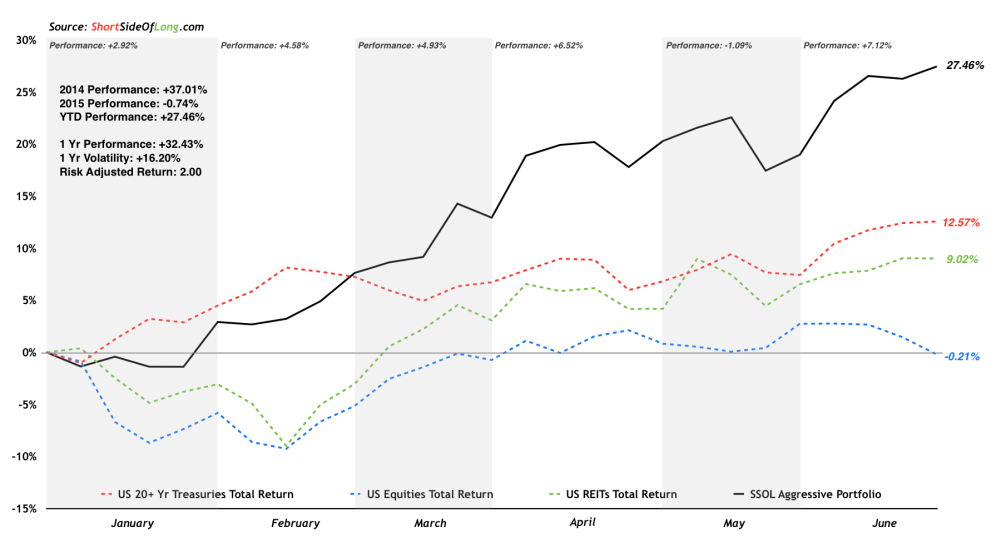
Finally, after a few questions regarding my portfolio mention in the last post, I thought I would discuss a bit further. I run private investment capital with two strategies. First is a low risk model, which averages half of the S&P 500’s volatility, but tries to achieve similar historical returns to the popular index itself. The second is an aggressive risk model, which I personally use for my own money. Historically, it has experienced similar volatility to the American equity index, but it has the potential to achieve some amazing returns (obviously, not without risk).
The model uses a variety of tools at an investors disposal which include momentum, trend, value investing, global macro exposure, risk parity diversification, leverage, a bit of tactical positioning and, of course, the one tool which you cannot program no matter how powerful your computer is…good old fashioned timing.
Regular readers know that I believe in buying market lows or selling market tops and have shown that over the years.
