Breakout In Nasdaq 100

Published 12/20/2016, 08:43 AM
Updated 05/14/2017, 06:45 AM
NDX
-
US500
-
US2000
-

The Nasdaq 100 broke out to the upside last week. If you look hard you can see it in the chart below. Yes it was more of a timid tap on the roof and then realization that it broke. But technically it has happened. The upper shadow or wick of the second to last candle pushed up to a new high on the weekly basis. It did not hold up at the end of the week, but Monday saw the move back higher. In the pre-market Tuesday the price is continuing to the upside.

The Nasdaq 100 has been lagging since the election, continuing to consolidate at its highs from 2001 and the summer. 15 years of history should take some time to erase, so the long consolidation is not unusual. What was though was the speed of the S&P 500 and Russell 2000 moves without the Nasdaq 100. Is it ready to catch up?
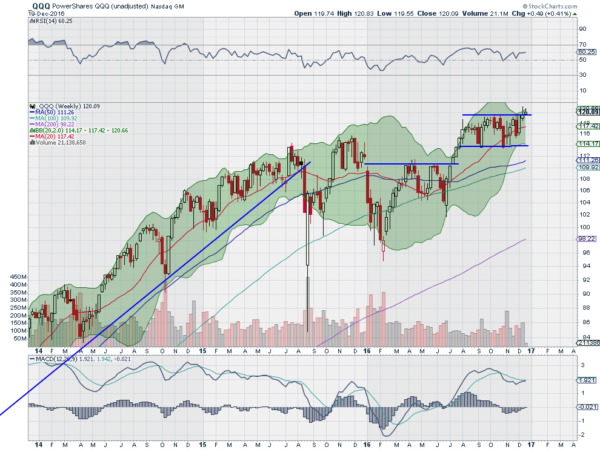
Nasdaq 100 Weekly Chart

The chart above suggest that may be the case, especially if it can hold the break out this week. That would give a target to the upside of 132. The Bollinger Bands® are opening to allow a move higher. The RSI is in the bullish zone. The MACD is turning back up and about to cross up. All of these indicators support a continued move higher. And a 12 point move higher would be only a subtle move in the QQQ’s of 10%, something the Russell 2000 did in just a couple of days. Fasten your seat belts. The Santa Claus rally may have begun in the Nasdaq 100 with that little tap last week.

The information in this blog post represents my own opinions and does not contain a recommendation for any particular security or investment. I or my affiliates may hold positions or other interests in securities mentioned in the Blog, please see my Disclaimer page for my full disclaimer.

Original post

Latest comments

Loading next article…
Risk Disclosure: Trading in financial instruments and/or cryptocurrencies involves high risks including the risk of losing some, or all, of your investment amount, and may not be suitable for all investors. Prices of cryptocurrencies are extremely volatile and may be affected by external factors such as financial, regulatory or political events. Trading on margin increases the financial risks.
Before deciding to trade in financial instrument or cryptocurrencies you should be fully informed of the risks and costs associated with trading the financial markets, carefully consider your investment objectives, level of experience, and risk appetite, and seek professional advice where needed.
Fusion Media would like to remind you that the data contained in this website is not necessarily real-time nor accurate. The data and prices on the website are not necessarily provided by any market or exchange, but may be provided by market makers, and so prices may not be accurate and may differ from the actual price at any given market, meaning prices are indicative and not appropriate for trading purposes. Fusion Media and any provider of the data contained in this website will not accept liability for any loss or damage as a result of your trading, or your reliance on the information contained within this website.
It is prohibited to use, store, reproduce, display, modify, transmit or distribute the data contained in this website without the explicit prior written permission of Fusion Media and/or the data provider. All intellectual property rights are reserved by the providers and/or the exchange providing the data contained in this website.
Fusion Media may be compensated by the advertisers that appear on the website, based on your interaction with the advertisements or advertisers.
© 2007-2025 - Fusion Media Limited. All Rights Reserved.