Five years ago, several European countries (e.g., Portugal, Italy, Greece, etc.) appeared as if they might default on their sovereign debt obligations. Gold prices spiked. The Japanese yen soared. U.S. Treasury bond yields plummeted. And the S&P 500 fell nearly 20% before globally coordinated central bank activity resuscitated investor appetite for U.S stocks.
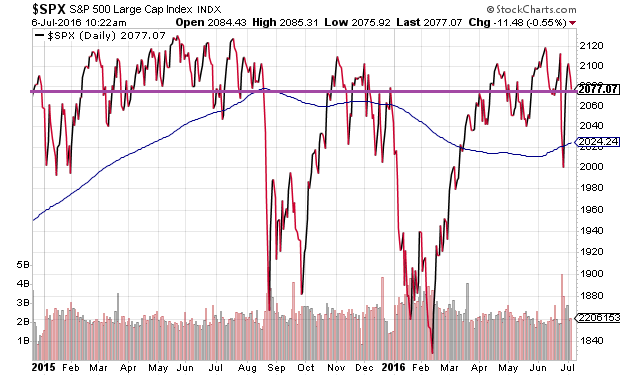
Today, Europe appears to be on the verge of another euro-zone crisis. This time, the United Kingdom’s decision to leave the European Union has threatened to destabilize the region’s economy as well as its financial institutions. Gold is surging. The yen is rocketing. Treasuries have been registering record lows. And yet, this time around, the S&P 500 trades approximately 2% off of an all-time peak.
In some ways, then, this time really is different. U.S. large capitalization stocks refuse to buckle under the weight of global economic uncertainty.
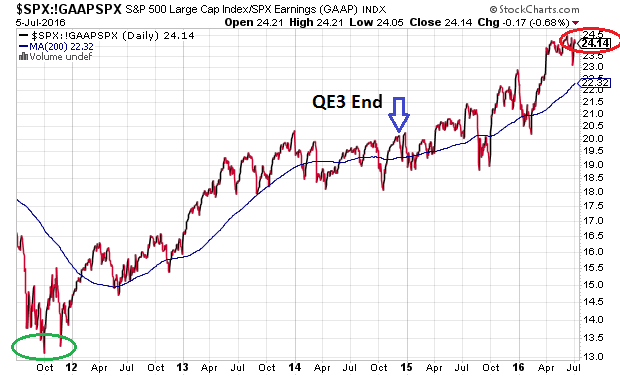
That said, an investor could grab the S&P 500 SPDR Trust (NYSE:SPY) for roughly 13x trailing twelve months of profits in the summer of 2011. Today? An exchange-traded enthusiast must be willing to pay north of 24x the benchmark’s collective corporate earnings per share.
Granted, there are those who do not see a problem with paying an exorbitant premium for the privilege of U.S. equity ownership. Nevertheless, these folks should at least be cognizant of the fact that valuations at nosebleed levels imply negligible returns in the future; they should be mindful that the high price for stock ownership has been rising, but not stocks themselves. They should also be aware that the S&P 500 has not gained ground since the Federal Reserve ended the creation of electronic dollars to stimulate the U.S. economy (a.k.a “QE3″).
“Risk-on” investors point to the resilience of U.S. large cap equities, as opposed the flatness of returns over the last 18 1/2 months. “Risk-off” investors point to the remarkable rise of assets like CurrencyShares Yen Trust (NYSE:FXY), SPDR Gold Trust (GLD (NYSE:GLD)) and iShares 20+ Year Treasury Bond (NYSE:TLT). Whose right?
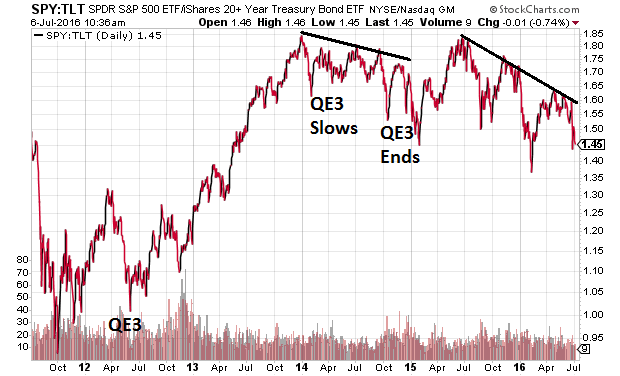
Although no individual can predict precisely what the future holds, there are ways to address the relative success of the S&P 500 in the face of global headwinds and pervasive safety-seeking. For example, the SPY:TLT price ratio demonstrates that the uptrend for large-cap equities has hit a snag since the “original” euro-zone crisis abated in October of 2011.
An easy way to grasp the SPY:TLT price ratio over time? When the Fed sought to reflate risk-taking with shock-n-awe QE3 stimulus, large-caps in the S&P 500 collectively exploded to the upside; meanwhile Treasury bonds lost their allure. On the flip side, as the Fed slowly cut back on its electronic money creation in 2014, SPY did not gain as much as long-maturity “risk-off” Treasuries. And when the Fed stopped printing electronic dollar credits in December of 2014 altogether, SPY eventually crested (May, 2015); SPY has been under-achieving ever since.
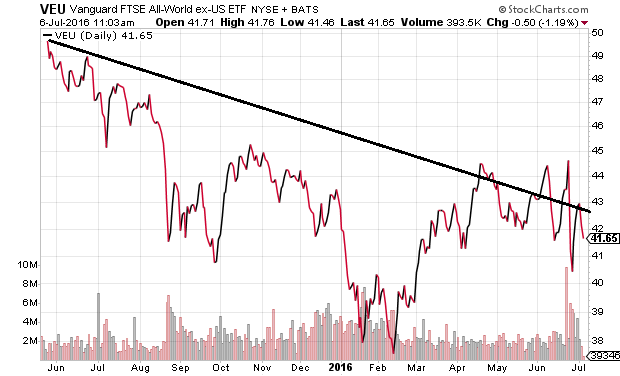
The chart above shows a clear pattern that the investment community covets “risk-off” assets more than “risk-on” assets like U.S. large cap stocks. Moreover, if one takes into account that half the world’s market cap is non-U.S. stock, there are few questions about the transition that occurred since popular world indexes hit critical high-water marks in May of 2015. The Vanguard FTSE All-World ex U.S ETF (NYSE:VEU) has been trending lower since May of 2015.
In truth, the notion of U.S. stock market resilience is less a reflection about the prospects for future reward and more about the belief system that the central banks – Federal Reserve, Bank of England, European Central Bank, Bank of Japan, People’s Bank of China – have the firepower to keep the wealth effect intact. After all, most people have lost count of how many times in the last year that these institutions have cut overnight lending rates (some into negative territory) and/or printed electronic money and/or backtracked on promises to raise overnight lending rates. Note: The Fed went from promises of four rate hikes in 2016 to an equal likelihood of a rate cut by December.
Bottom line? Nobody knows what the future holds. On the flip side, if one buys more U.S. equities today, one should be convinced that the world’s central banks still know how to push asset prices higher. Conversely, if one holds 25% in cash and another 25% in investment grade U.S. bonds (and perhaps some gold), one may be persuaded that “risk-off” asset success is a clear signal that the global economy is in serious trouble.
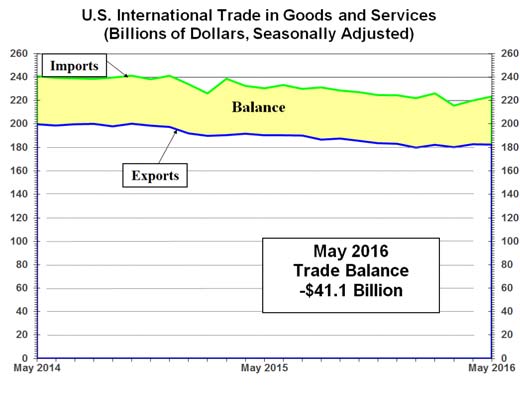
(Note: If the widening of the U.S trade gap is any indication – if the general downtrend in global trade is a sign – overseas demand for American goods/services is waning. That may not bode well for corporate earnings or corporate guidance or stock share valuations.)
Disclosure: Gary Gordon, MS, CFP is the president of Pacific Park Financial, Inc., a Registered Investment Adviser with the SEC. Gary Gordon, Pacific Park Financial, Inc, and/or its clients June hold positions in the ETFs, mutual funds, and/or any investment asset mentioned above. The commentary does not constitute individualized investment advice. The opinions offered herein are not personalized recommendations to buy, sell or hold securities. At times, issuers of exchange-traded products compensate Pacific Park Financial, Inc. or its subsidiaries for advertising at the ETF Expert web site. ETF Expert content is created independently of any advertising relationships.
Which stock should you buy in your very next trade?
AI computing powers are changing the stock market. Investing.com's ProPicks AI includes 6 winning stock portfolios chosen by our advanced AI. In 2024 alone, ProPicks AI identified 2 stocks that surged over 150%, 4 additional stocks that leaped over 30%, and 3 more that climbed over 25%. Which stock will be the next to soar?
Unlock ProPicks AI
