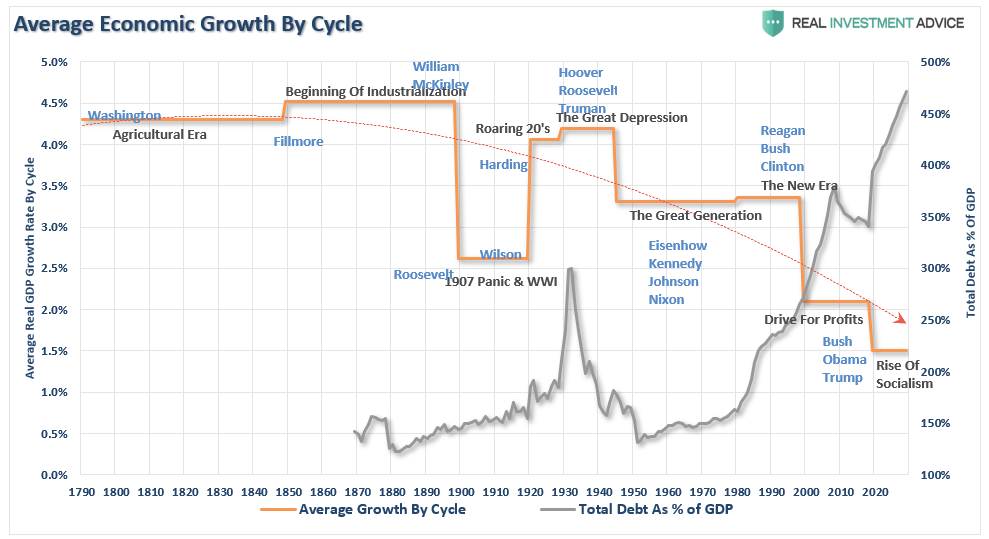
Recently, I discussed the “Two Pins That Pop The Bubble,” specifically noting the risk of rising interest rates and inflation. However, the real threat is not just the stock market bubble’s deflation but rather blowing up the “everything bubble.”
During previous periods in financial history, the focus was primarily on the deflation of a singular market bubble. Such was a point we touched on in “Extraordinary Popular Delusions:” The two tables below show the history of bubbles and what they all had in common.
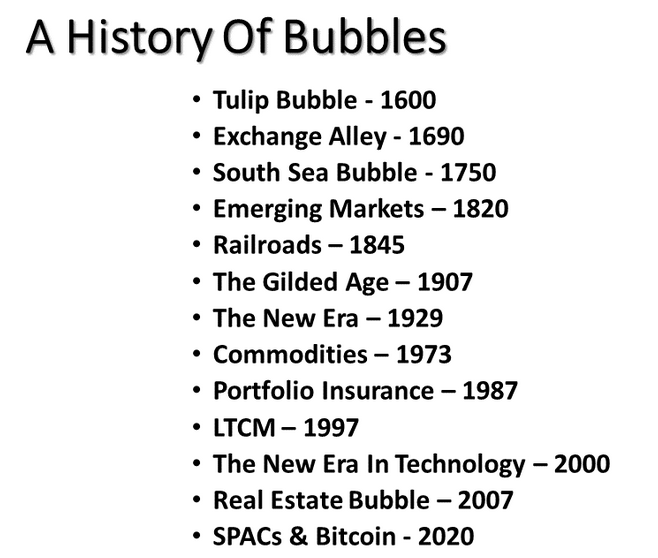
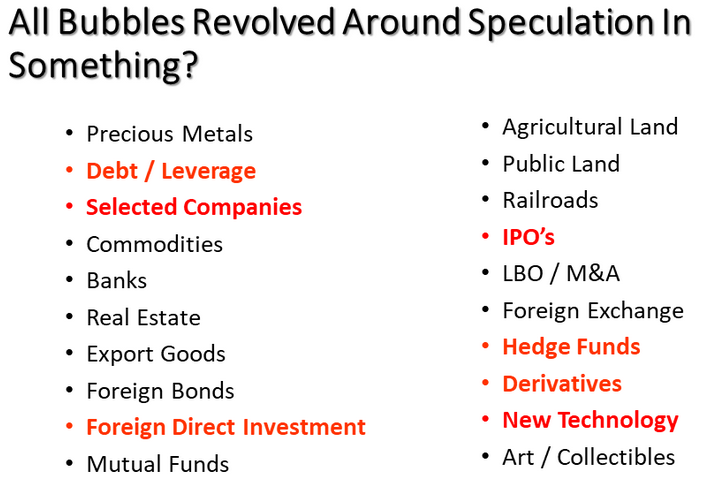
The flood of liquidity and ultra-accommodative monetary policies has simultaneously inflated multiple bubbles. Stocks, bonds, real estate, and speculative investments have all experienced historic inflations.
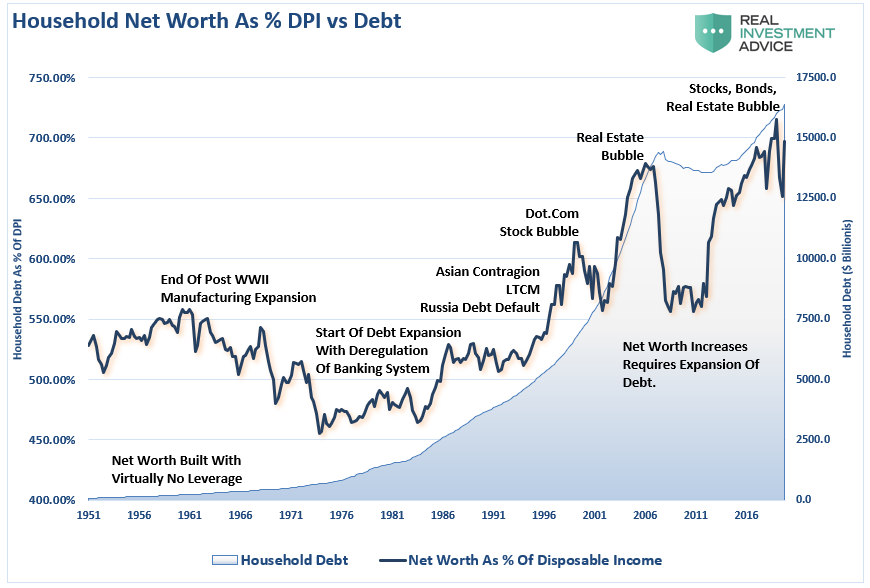
The byproduct of cheap debt and liquidity is the explosion of household net worth as a percentage of disposable personal income. Starting in the early 80s, as President Reagan deregulated the banking system, net worth exploded through massive leverage increases. Such was made possible by four decades of continually falling interest rates and inflation.
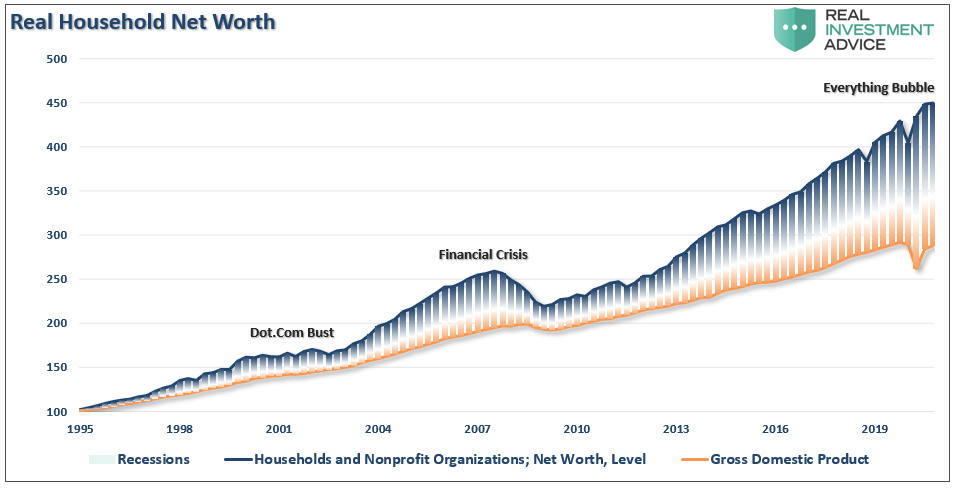
Another view is to look at the expansion of net worth relative to GDP growth. Of course, the massive deviation would not be possible without the massive increases in leverage over the last 40-years.
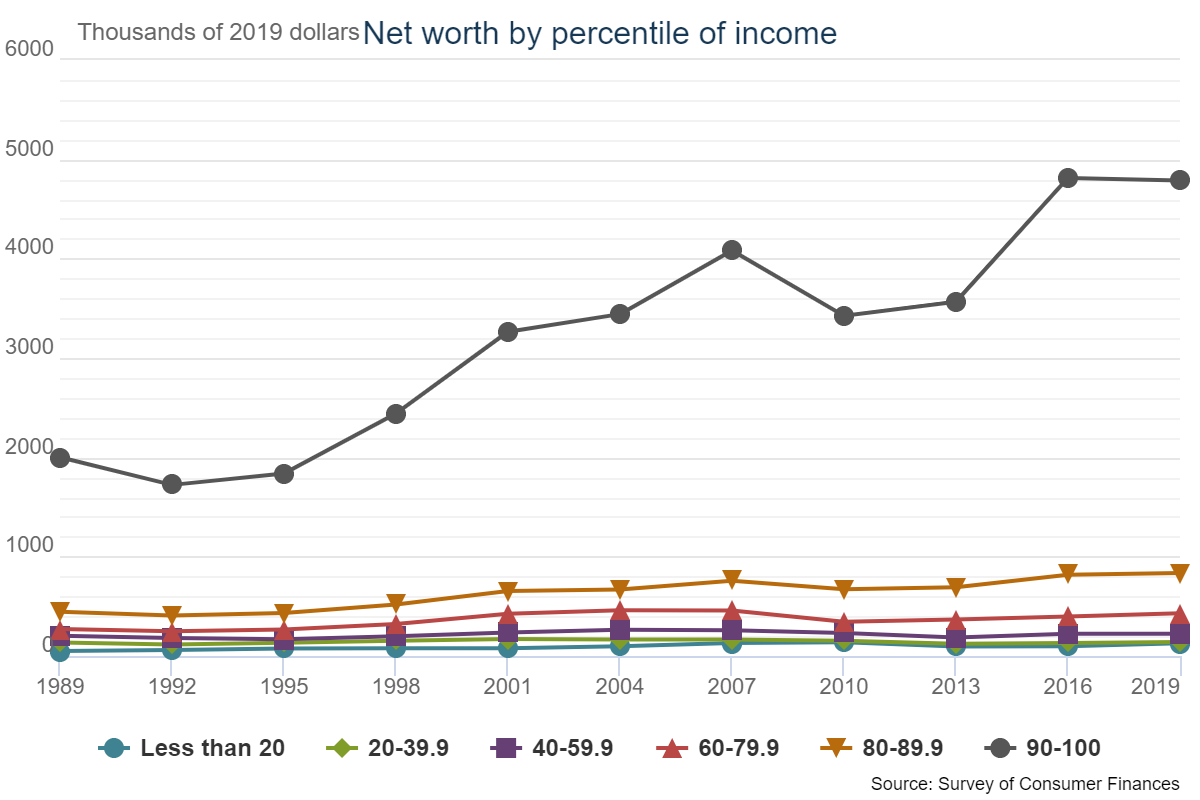
However, ironically, while it appears that Americans are far more wealthy, in reality, it is only a small fraction of the population that has benefitted. A point we made in “The Fed Made The Top 10% Richer.”
This framework is the basis for the rest of our discussion on the coming deflation of the “Everything Bubble.”
The Stock Bubble
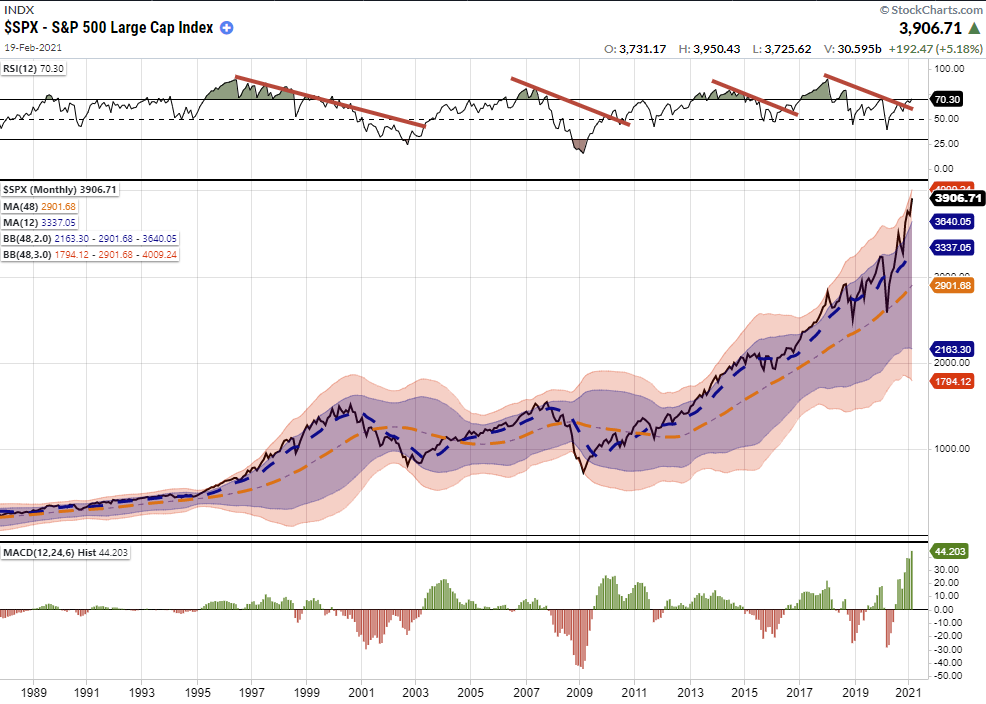
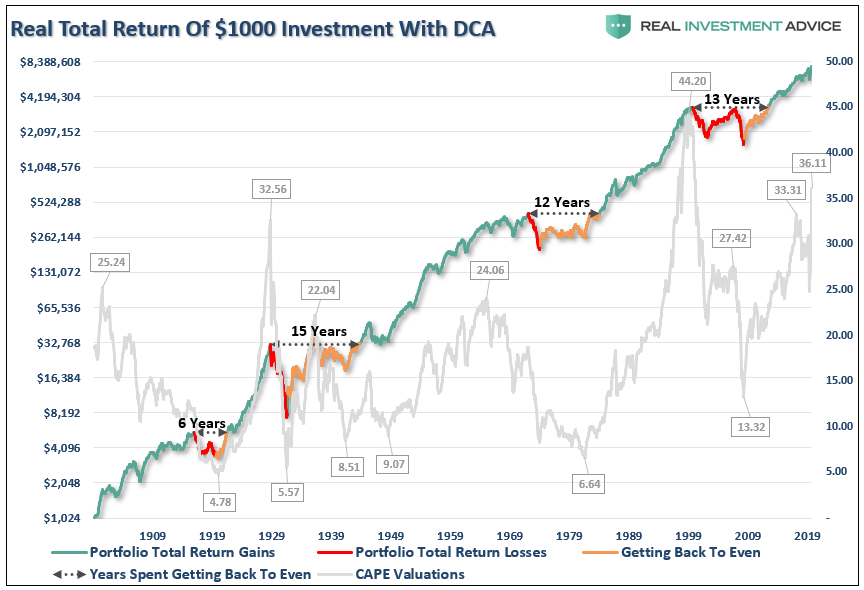
There is little argument that financial markets are currently in a “bubble.” The monthly chart of the S&P 500 shows the deviation from long-term monthly means at levels not seen since 1990.
As discussed in “Yes, There Is A Stock Market Bubble,” valuations are just a reflection of the underlying psychology at the second-highest level in history. As noted:
“If market bubbles are about ‘psychology,’ as represented by investors’ herding behavior, then price and valuations are reflections of that psychology. In other words, bubbles can exist even at times when valuations and fundamentals might argue otherwise.”
During a “market mania,” investors must continue to rationalize overpaying for assets to keep prices moving higher. Over the last decade, the most common justification remains that low discount rates justify high valuations.
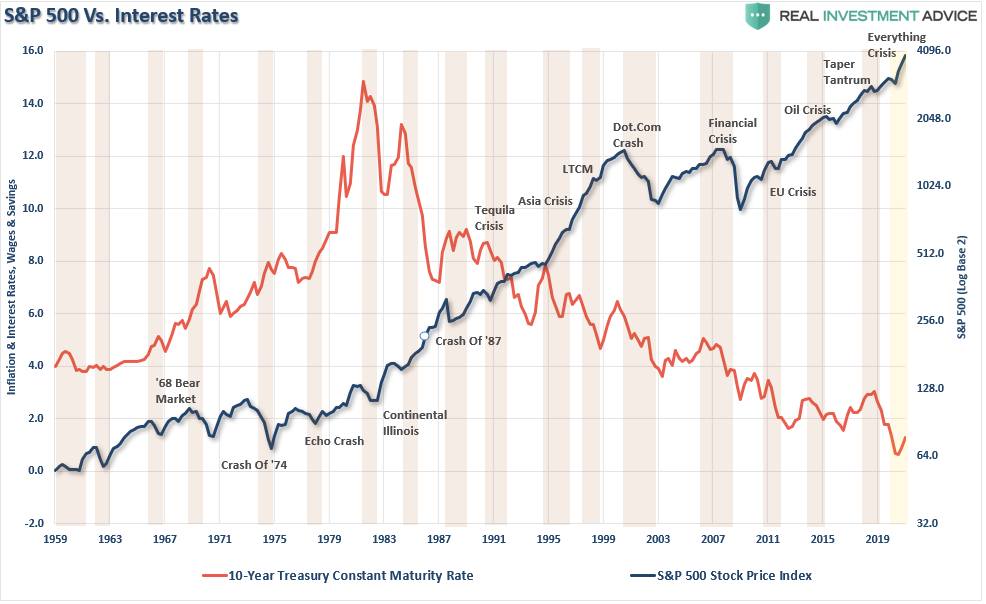
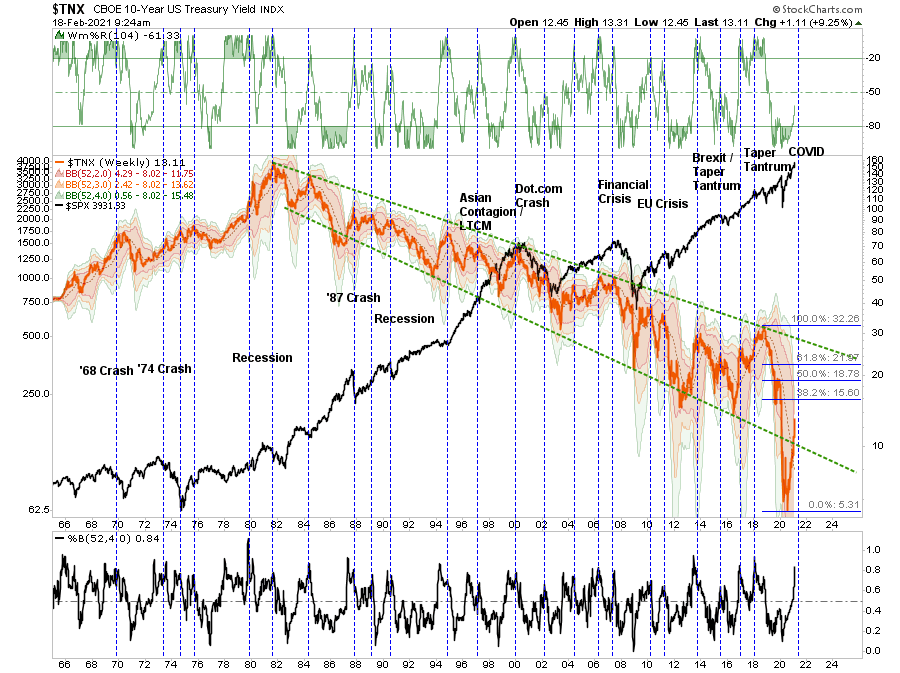
The problem comes when interest rates rise. Throughout history, an unexpected surge in interest rates has repeatedly led to poor investor outcomes.
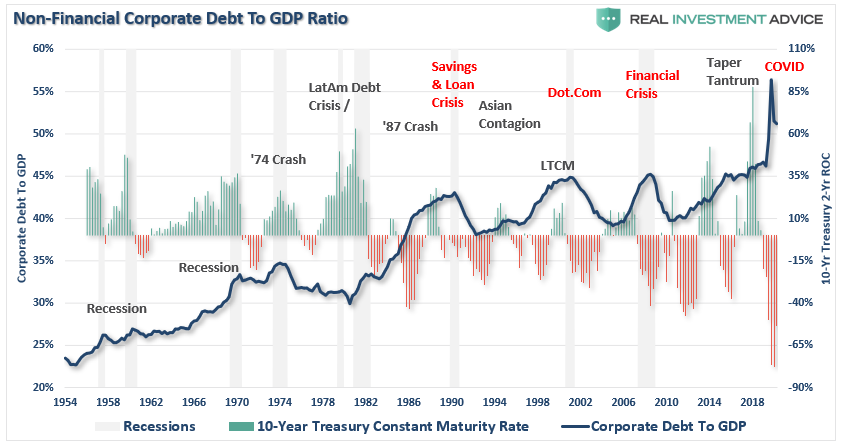
Despite media rhetoric that “rising rates” aren’t a problem for the stock market, history suggests they are. Given the massive surge in corporate leverage promulgated by weak economic growth, higher rates will quickly impact corporate profitability and financing activities.
As history shows, such collisions have often left a trail of bodies in its wake.
The Real Estate Bubble
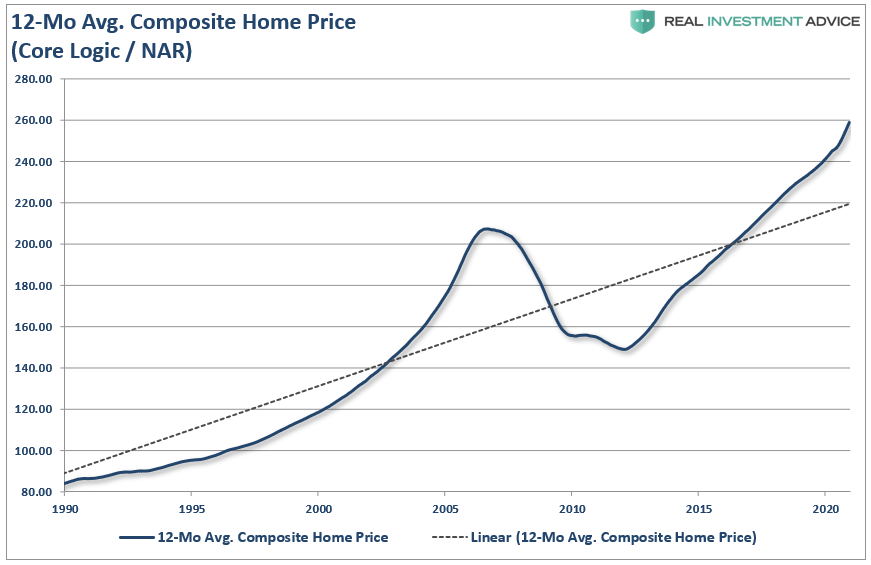
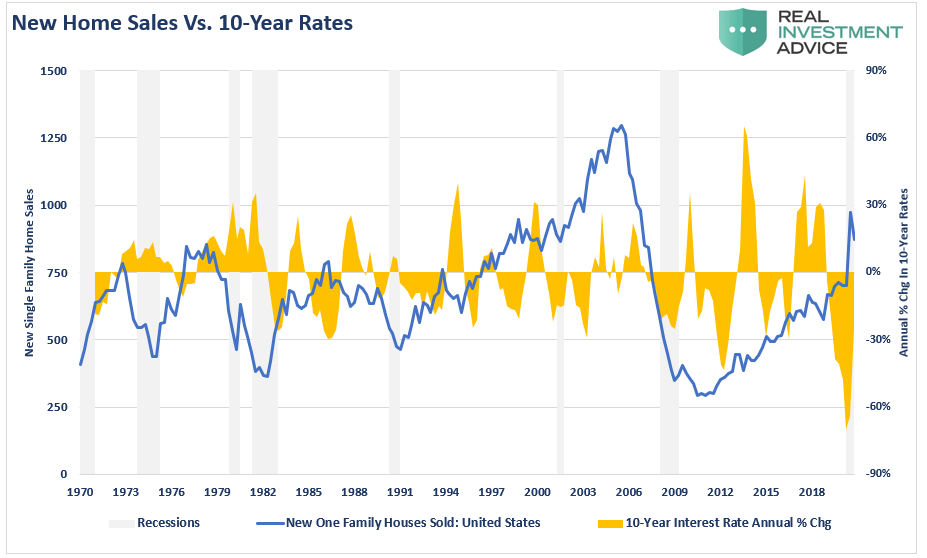
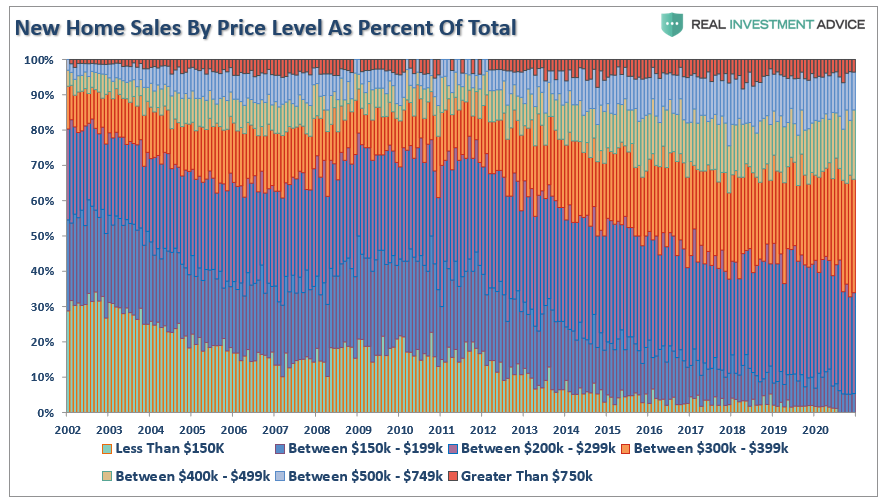
Currently, there is also a “bubble” once again in housing as a continual suppression of borrowing costs, loose lending policies, and a flood of stimulus has led to a historical surge in home prices. As we noted previously in “There Is No Supply Shortage,” home price appreciation has once again eclipsed long-term price trends.
The current overvaluation in homes, of course, is driven by record-low mortgage rates.
However, as noted above, that economic support will quickly reverse as interest rates rise. Given there is a surging demand for homes, just as with the stock market, when rates rise, there will be a rush to sell to a diminishing pool of buyers.
Also, as with the stock market, owned by the top 20% of income earners, most houses bought were by that same fraction of the population. (Higher incomes and nearly perfect credit.)
Given the sharp rise in prices, the resulting price decline will likely be equally as quick.
The Bond Bubble
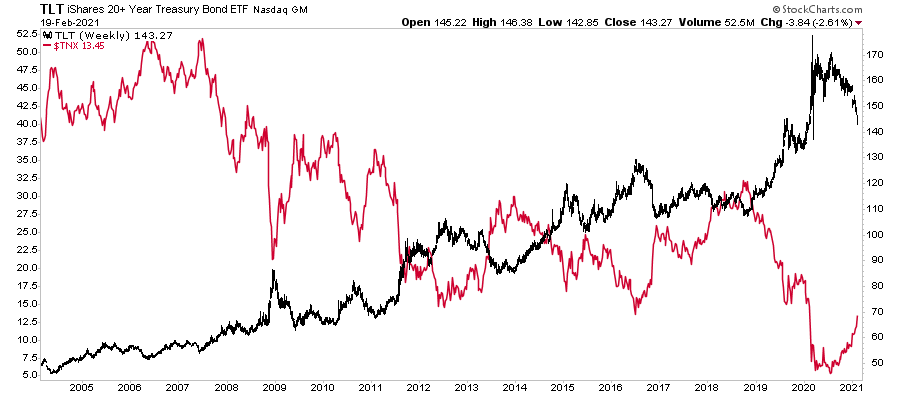
Of course, there is nowhere more at risk from higher rates than the bond market itself. Given that “yield” is a function of price, there is a perfectly negative correlation between prices and interest rates.
I pointed out before the “pandemic-driven shut-down” the 2019 yield-curve inversion was signaling a problem with the bond market. To wit:
“The magnitude of the Fed’s response was also a function of “panic” based more on “recency bias” than facts. The Fed quickly returned to the “Financial Crisis” playbook to anticipate events that may occur in the credit markets rather than responding to outcomes.
There is a difference.
The Financial Crisis was a problem with the banking system. The COVID-19 pandemic is a health crisis.”
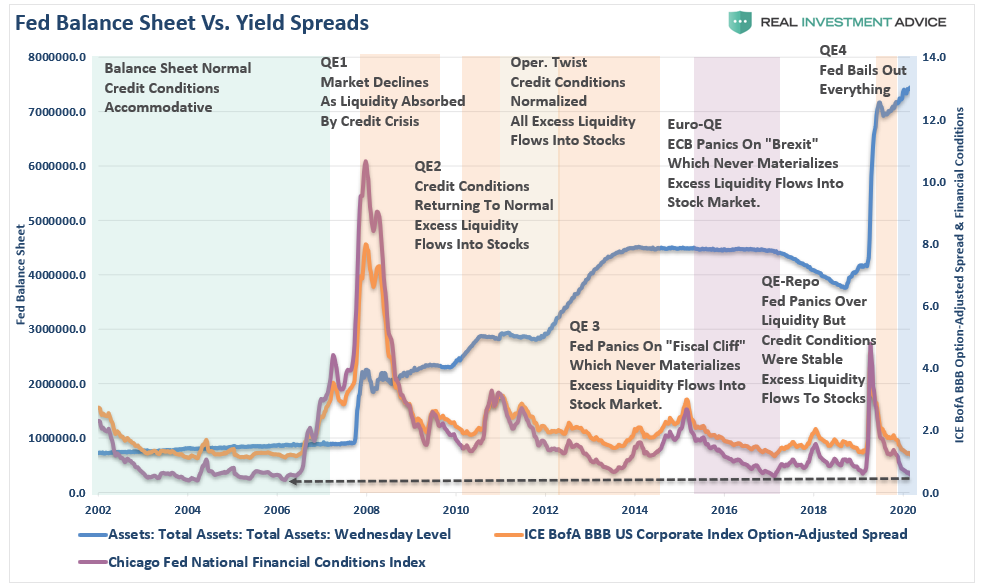
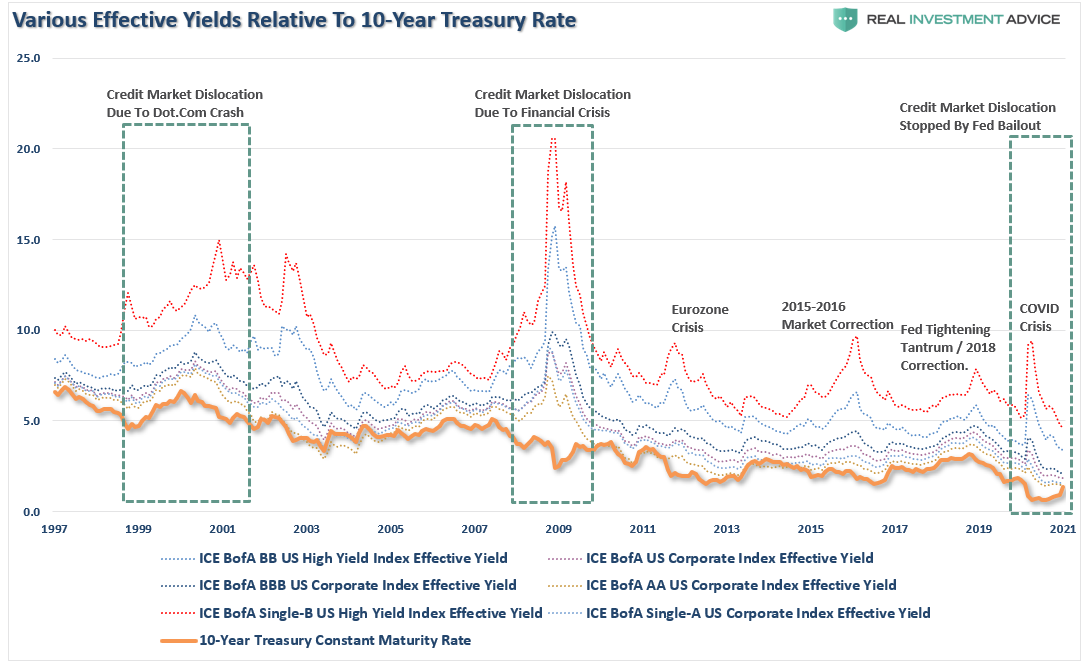
The Federal Reserve problem is they have now pushed “yield spreads” across the entirety of the credit spectrum to record lows. The Fed’s suppression of rates to “bail-out” the bond market in the short-term has created a long-term problem of “mispricing risk.”
That mispricing of risk, or rather the creation of “moral hazard,” in the credit markets created a record number of “zombie” companies in the process.
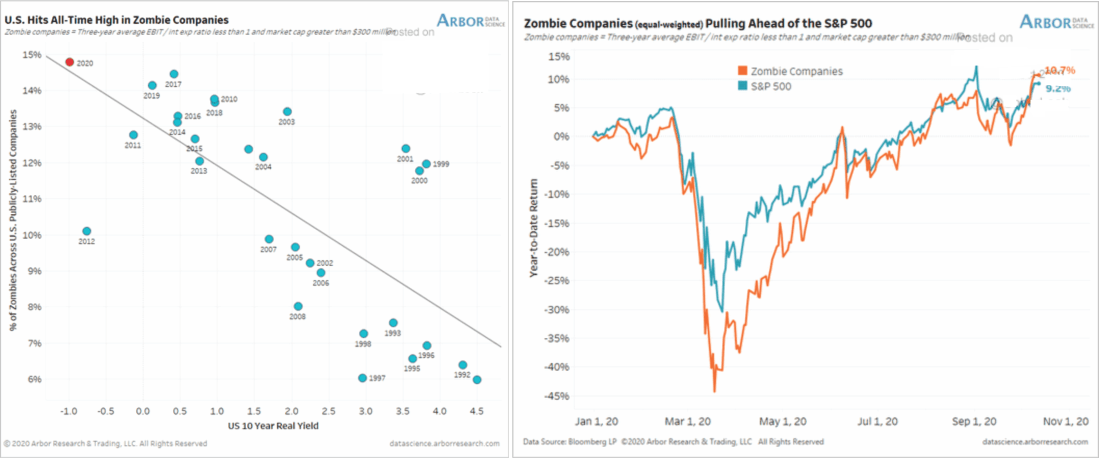
Eventually, when rates rise enough, these “zombie” companies will be unable to refinance debt for their continued survival. Once bankruptcies begin to spike uncontrollably, investors will demand to get paid for their investment risk. As shown, such has occurred in the past with relatively dismal outcomes.
As they found out back in March, the Fed can only buy a small fraction of corporate bonds without disrupting the market.
The risk is a surge in rates and defaults, greater or faster than the Federal Reserve can absorb.
The Unwinding
What should be clear is that if the rise in interest rates approaches 2% or higher, there are many problems embedded in an economy laden with nearly $85 trillion in debt.
The debt problem exposes the Fed’s most significant risk. Given economic growth remained elusive over the last decade, it is unlikely doubling the Fed’s balance sheet will improve future outcomes. The failure to recognize the impact of ongoing monetary policies, given a decade of experience of surging debt and deficits inhibiting organic growth, is problematic.
The US economy is literally on perpetual life support. Recent events show too clearly that unless fiscal and monetary stimulus continues, the economy will fail and, by extension, the stock market.
However, the Fed currently has no choice.
Such is the consequence, and problem, of getting caught in a “liquidity trap.”
What the average person fails to understand is that the next “financial crisis” will not just be a stock market crash, a housing bust, or a collapse in bond prices.
It could be the simultaneous implosion of all three.
Whatever causes that change in sentiment is unknown to me or anyone else.
I am not saying with certainty it will happen, as I hope sanity prevails and actions are taken to mitigate the consequences.
Unfortunately, history suggests such is unlikely to be the case.

