- US-China trade news has impacted Bitcoin market volatility.
- Holding $75,000 support is crucial for stability.
- A break above $82,300 could signal bullish momentum.
- Looking for more actionable trade ideas to navigate the current market volatility? Subscribe here to unlock access to ProPicks AI winners.
The 90-day tariff delay announced by US President Donald Trump gave Bitcoin a boost. The cryptocurrency bounced back from an important support level. On April 9, its price went up by nearly 10% to $83,500. This quick jump, backed by on-chain data, showed that investors react fast to good global news.
Tariff Delay Sparks Bitcoin Rally
When the Trump administration lowered tariffs to 10% for most countries—but not China—it eased market uncertainty for 90 days. This move sparked a strong reaction from both the stock and crypto markets. The S&P 500, Dow Jones, and Nasdaq all rose by 5% to 8%, showing renewed interest in risky assets.
On the crypto side, the halt in capital outflows from Bitcoin ETFs suggests that investor confidence is returning. According to CoinGlass data, spot Bitcoin ETFs saw a total outflow of $326 million earlier in the week. But after Trump's announcement, these outflows came to a stop.
On-Chain Data Confirms Institutional Interest
CryptoQuant data shows that 48,575 BTC—worth about $3.6 billion—was moved to savings addresses on April 9. This is the biggest one-day BTC inflow in three years and signals that long-term or institutional investors may be coming back.
IntoTheBlock analysis also points to a sharp rise in inflows to large BTC wallets over the past 90 days. Notably, there is an increase in addresses holding between 1,000 and 10,000 BTC. This suggests that big investors are adjusting their positions. Despite short-term price dips, long-term holders seem confident and are continuing to buy.
China Uncertainty Still a Significant Risk
Although the tariff cuts applied to most countries, China was left out. The US raised tariffs on Chinese goods to 145%, and China responded with a 125% tariff on US products. This move is likely to worsen the US-China trade war.
In the short term, this tension is adding to volatility in the crypto market. However, there is a growing belief that a potential US-China trade deal could spark a new rally in BTC prices. Along with the tariff war, ongoing currency tensions are also hurting both economies. A trade agreement could ease pressure and lead to a positive shift in the markets.
Bitcoin Technical Outlook

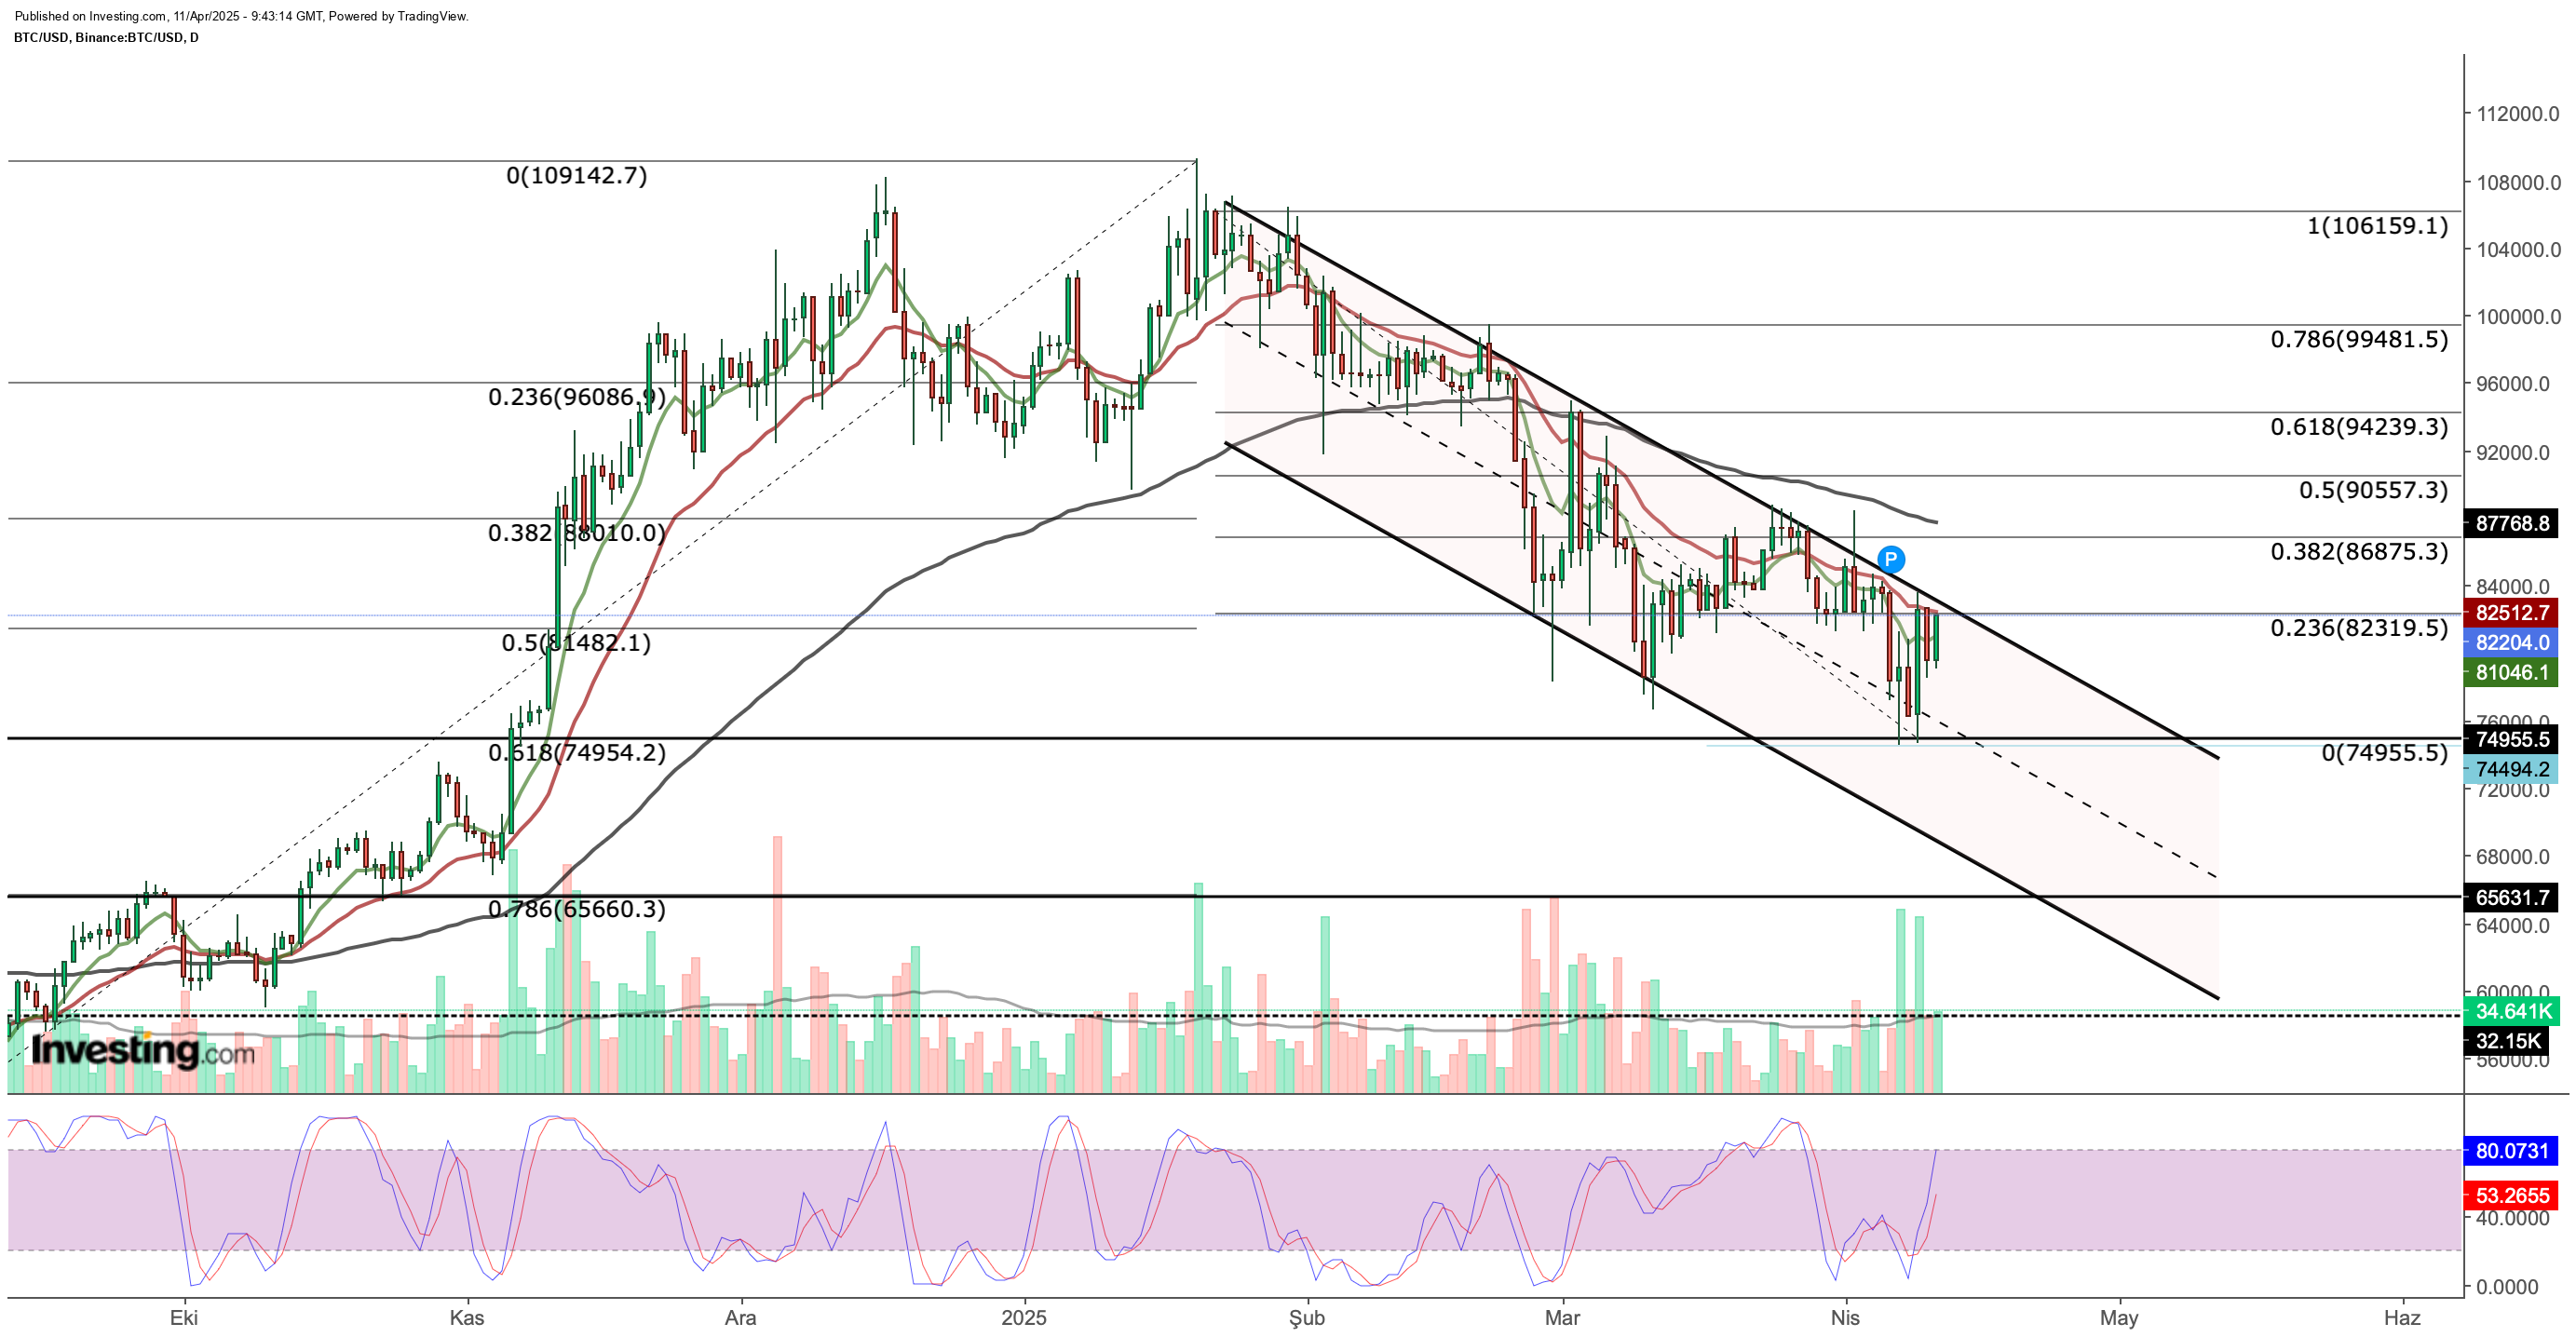
Bitcoin is currently searching for technical direction. While macro data and on-chain activity point to upside potential, the BTC price is still moving in a falling channel, indicating that bearish risk remains. A potential trade deal could be an effective catalyst for a trend reversal in prices.
Bitcoin continues to move in a falling channel pattern on the daily chart, with the price hovering around $81,600. The price, especially below the short and medium-term moving averages, reveals that technical pressure continues. According to technical indicators and critical levels, BTC has significant resistance to overcome. The short-term EMA levels are still above the price, indicating that the negative momentum continues. In order for Bitcoin to recover, it needs to break above these averages first.
The first technical hurdle on the daily chart is the $82,300 level, which works as an important resistance as it is the intersection of the upper band of the falling channel and the Fib 0.236 level. BTC's failure to cross this level could increase selling pressure.
The second resistance level is at approximately $87,000, which coincides with the Fib 0.382 retracement level and the 3-month EMA standing out as a confirmation point of a trend reversal.
Prominent Support Levels on Possible Pullbacks
The key support level to watch below is $75,000. This zone is a strong technical support, lining up with the midpoint of the falling channel and the 0.618 Fibonacci level. If this area breaks, selling could increase, pushing the price down toward the $65,600 range. Earlier this week, buyers stepped in strongly at $75,000, showing it also acts as a psychological support.
On the daily chart, the Stochastic RSI has turned upward from oversold levels. This suggests a possible short-term rebound. Still, for any recovery to last, Bitcoin needs to break above the $82,300 resistance with strong volume.
Right now, Bitcoin remains in a sideways-to-downward trend in the short term. A clear move past $82,300 is needed for bullish momentum to build. Until then, the range between $75,000 and $87,000 will be key. Daily closes near these levels will help signal the next major move.
***
Be sure to check out InvestingPro to stay in sync with the market trend and what it means for your trading. Whether you’re a novice investor or a seasoned trader, leveraging InvestingPro can unlock a world of investment opportunities while minimizing risks amid the challenging market backdrop.
Subscribe now and instantly unlock access to several market-beating features, including:
- ProPicks AI: AI-selected stock winners with proven track record.
- InvestingPro Fair Value: Instantly find out if a stock is underpriced or overvalued.
- Advanced Stock Screener: Search for the best stocks based on hundreds of selected filters, and criteria.
- Top Ideas: See what stocks billionaire investors such as Warren Buffett, Michael Burry, and George Soros are buying.

Disclaimer: This article is written for informational purposes only. It is not intended to encourage the purchase of assets in any way, nor does it constitute a solicitation, offer, recommendation or suggestion to invest. I would like to remind you that all assets are evaluated from multiple perspectives and are highly risky, so any investment decision and the associated risk belongs to the investor. We also do not provide any investment advisory services.
