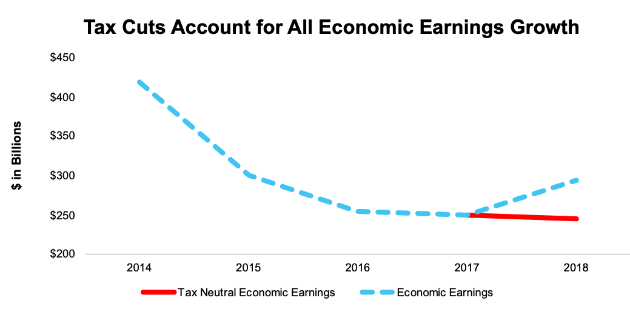
Publicly traded U.S. companies[1] grew reported earnings by 23% in 2018, but economic earnings – the true cash flows of the business – tell a much different story. On the surface, economic earnings grew by 18%. When we remove the impact of the tax cut, they actually declined by 2%, as shown in Figure 1.
Figure 1: Economic Earnings vs. Tax Neutral Economic Earnings
Sources: New Constructs, LLC and company filings.
GAAP earnings don’t just mislead investors about the amount of growth in 2018, they also present a misleading picture of the breadth of earnings growth. 8 out 11 sectors reported rising earnings in 2018. Meanwhile – even with the benefit of the tax cut – only two sectors significantly improved on an economic earnings basis.
Top-Loaded Tech
Economic earnings in the Technology and Energy sectors improved by ~$50 billion in 2018. The other nine sectors combined saw economic earnings decline by ~$50 billion.
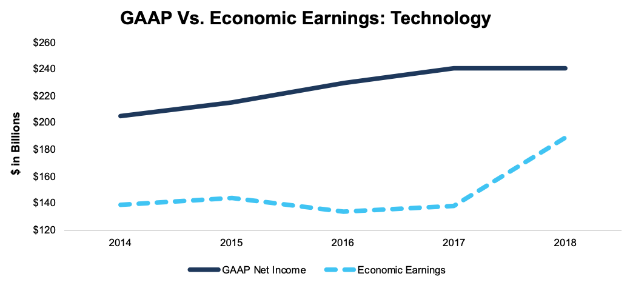
While the economic earnings growth in the Technology and Energy sectors looks positive, it comes with significant caveats. In the Technology sector, all of the economic earnings growth in 2018 came from 25 (out of 430) companies. Just four companies – Micron (NASDAQ:MU), Apple (NASDAQ:AAPL), Microsoft (NASDAQ:MSFT), and Facebook (NASDAQ:FB) – accounted for over 50% of the sector’s economic earnings growth.
Figure 2: Economic vs. GAAP Earnings: Technology
Sources: New Constructs, LLC and company filings.
GAAP earnings don’t capture the tech sector’s economic earnings growth in 2018 due to the impact of the Tax Cuts and Jobs Act. For example, Microsoft’s 2018 GAAP earnings were negatively impacted by a $13.7 billion one-time charge due to tax reform and fell by $4.6 billion. Meanwhile, Microsoft’s economic earnings – which we adjust for all non-recurring charges – increased by $7.3 billion in 2018.
Energy Sector Rebounds
The economic earnings growth in the Energy sector was more broad-based than the Technology sector, but it also comes with plenty of caveats.
For one, the improvement in the Energy sector was due primarily to a 28% increase in the average price of oil in 2018. With oil prices having fallen to a lower level to start 2019, that growth may be difficult to sustain.
On the positive side, companies in the sector appear to be focusing more on capital allocation. Pressure from investors has led to major companies in the industry, such as Occidental Petroleum (NYSE:OXY), adding return on capital metrics to their executive compensation plans.
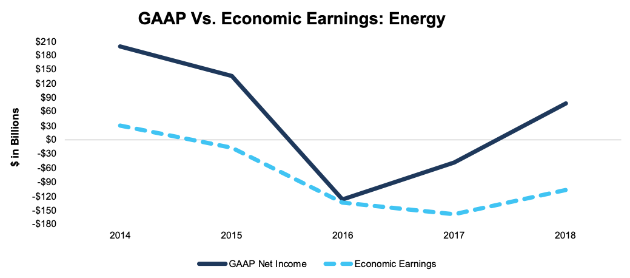
Despite these encouraging signs, economic earnings in the Energy sector remain negative. Companies in the sector combined for economic losses of $108 billion in 2018, as shown in Figure 3.
Figure 3: Economic vs. GAAP Earnings: Energy
Sources: New Constructs, LLC and company filings.
The Energy sector appears to be rebounding off its lows, but its positive GAAP earnings are misleading. The sector still has a way to go to break even on an economic basis.
Why Our Adjustments Matter
The disconnect between accounting and economic earnings in the market stems from two primary issues:
- Income statement manipulation: managers exploit accounting loopholes to overstate accounting profits. GAAP net income has grown 6% compounded annually over the past four years for the companies in Figure 1, but net operating profit after tax (NOPAT) is up only 5% compounded annually over that timeframe (and only 4% annually without the tax cut).
- GAAP earnings overlook balance sheets and the cost of equity capital. Over the past four years, the balance sheets, i.e. invested capital of the companies in Figure 1 have increased by 6% compounded annually. Their weighted average cost of capital (WACC) is up from 5.7% to 6.5% over the same time.
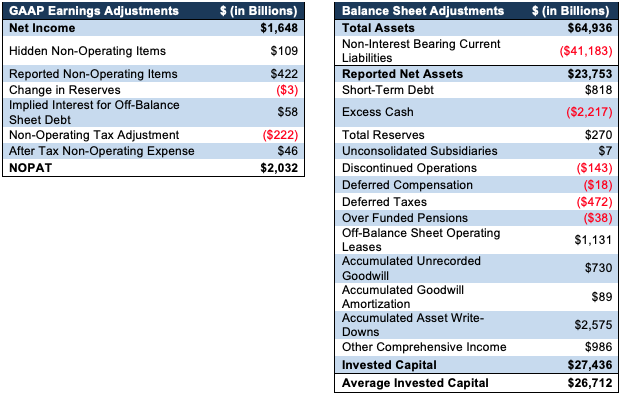
Economic earnings equal NOPAT - (WACC*Invested Capital). When NOPAT grows slower than net income while invested capital and WACC grow faster, economic earnings decline. Figure 4 details the adjustments we make to calculate the current NOPAT and invested capital values for the whole market.[2]
Figure 4: Reconciling GAAP Earnings with Economic Earnings: NOPAT and Invested Capital
Sources: New Constructs, LLC and company filings.
Our biggest adjustment for NOPAT/Income Statement is to strip out $422 billion in “Reported” non-operating items. These gains/losses are reported on the income statement, e.g. interest expense, preferred dividends, and minority interest income. Even more impactful, according to research from Ernst & Young, are the “Hidden” non-operating items, which amount to $109 billion of gains//losses that investors can find only in the footnotes.
For the balance sheet, our biggest adjustment is to add back $2.6 trillion in accumulated asset write-downs that companies tried to move off their balance sheet. We collect hundreds of unusual write-down charges over many years of history to derive accumulated write-downs. The purpose of this adjustment is to hold companies accountable for all the capital invested in the business over its life.
Only by making these adjustments can investors reverse accounting distortions and reveal true profitability[3].
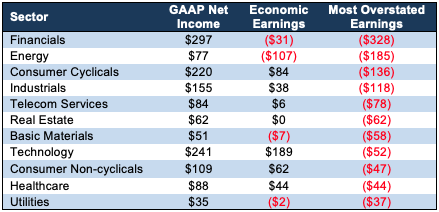
Figure 5 provides a quick summary of the sectors and how much their accounting income is overstated. Figures 6-14 compare economic earnings to GAAP net income for each sector.
Figure 5: TTM Economic Vs. GAAP Earnings: All Sectors ($ in billions)
Sources: New Constructs, LLC and company filings.
Basic Materials Sector
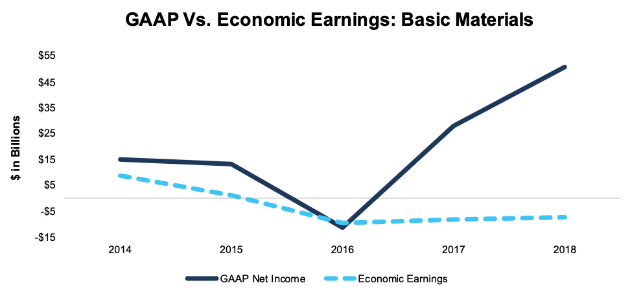
GAAP earnings show a large rebound after the commodities rout caused significant write-downs in 2015-2016. Economic earnings show that this sector still has a long road ahead to recovery. DowDuPont Inc. (DWDP) had the largest discrepancy between reported net income and economic earnings. GAAP net income of $3.8 billion vastly overstated the firm’s profitability while economic earnings, at -$3.6 billion reveal significant losses. We will be curious to see the breakdown of how these losses are allocated after the split between Dow and DuPont (NYSE:DWDP).
Figure 6: Economic vs. GAAP Earnings: Basic Materials
Sources: New Constructs, LLC and company filings.
Consumer Cyclicals Sector
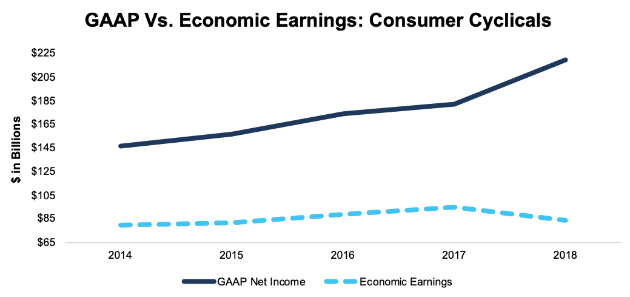
Part of the significant gap between GAAP net income and economic earnings for the Consumer Cyclicals sector can be explained by off-balance sheet operating leases that constitute a hidden (although not for long) form of invested capital. Operating leases account for 9% of all invested capital in the sector, compared to just 4% for the whole market. Return on invested capital (ROIC) stayed constant at 9% in 2018, so the decline in economic earnings comes entirely from rising WACC.
Figure 7: Economic vs. GAAP Earnings: Consumer Cyclicals
Sources: New Constructs, LLC and company filings.
Consumer Non-Cyclicals Sector
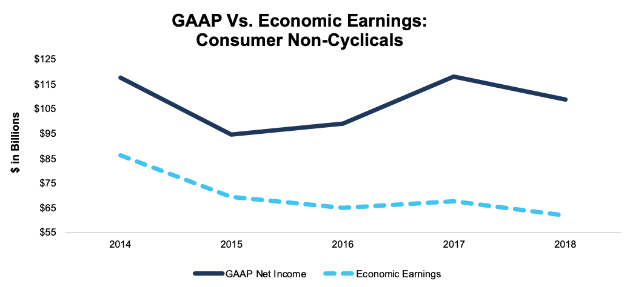
Unlike with other sectors, GAAP and economic earnings tend to move in the same direction for the Consumer Non-Cyclicals sector. The major write-downs at Kraft Heinz (NASDAQ:KHC) – and the declining economic earnings at competitor Mondelez (NASDAQ:MDLZ) – suggest that some of the giants of this sector are seeing their competitive advantage decline.
Figure 8: Economic vs. GAAP Earnings: Consumer Non-Cyclicals
Sources: New Constructs, LLC and company filings.
Financials Sector
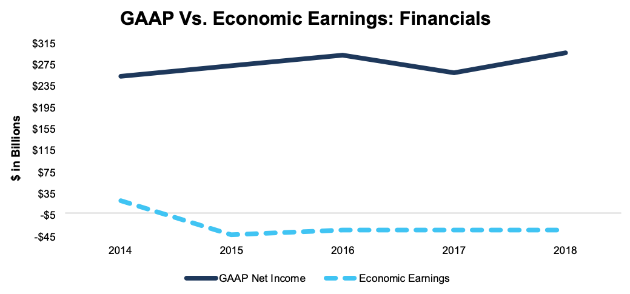
The Financials sector has only earned positive economic earnings on aggregate in one of the past five years. Economic losses shrunk slightly in 2018, from -$32 to -$31 million, but GAAP net income grew by 14%. The market seems to recognize that GAAP earnings in this sector are an illusion, as Financial stocks are much cheaper than the rest of the market. On aggregate, the sector has a price to economic book value (PEBV) of 1.1 compared to 1.6 for the total market.
Figure 9: Economic vs. GAAP Earnings: Financials
Sources: New Constructs, LLC and company filings.
Healthcare Sector
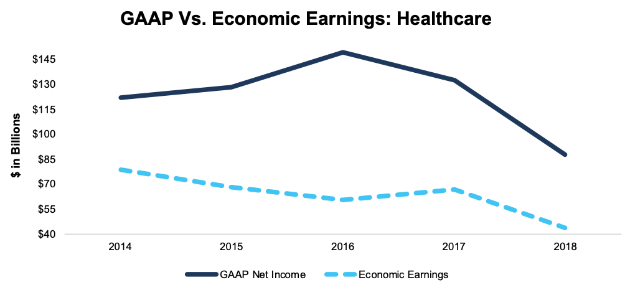
GAAP and economic earnings moved in-line for the Healthcare sector in 2018 as both fell by ~35%. Combined with the continued threat of regulatory overhauls and pricing pressure, these falling earnings represent a significant cause for concern.
Figure 10: Economic vs. GAAP Earnings: Healthcare
Sources: New Constructs, LLC and company filings.
Industrials Sector
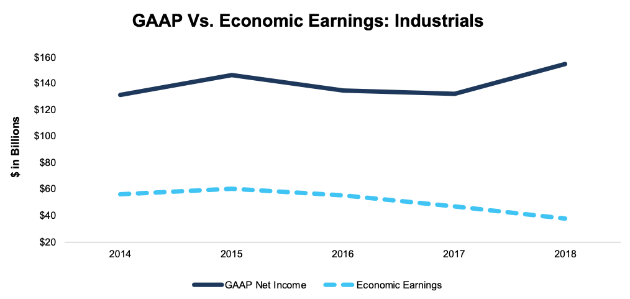
Few sectors have as wide a divergence as the Industrials sector. GAAP earnings grew by 17% while economic earnings declined 21% in 2018. M&A activity accounts for some of this discrepancy. We highlighted recently how United Technologies’ (UTX) acquisition of Rockwell Collins (NYSE:COL) helped it grow reported earnings by 14% but led to a 16% decline in economic earnings.
Figure 11: Economic vs. GAAP Earnings: Industrials
Sources: New Constructs, LLC and company filings.
Real Estate Sector
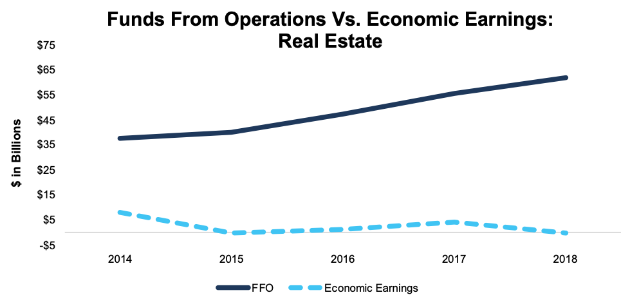
The Real Estate sector has just barely scraped out positive economic earnings over the past five years while fund from operations (FFO) grew by 64% between 2014-2018. The divergence between reported and economic earnings goes a long way to explain why Real Estate is our worst-rated sector for ETFs and mutual funds.
Figure 12: Economic Earnings vs. FFO: Real Estate
Sources: New Constructs, LLC and company filings.
Telecom Sector
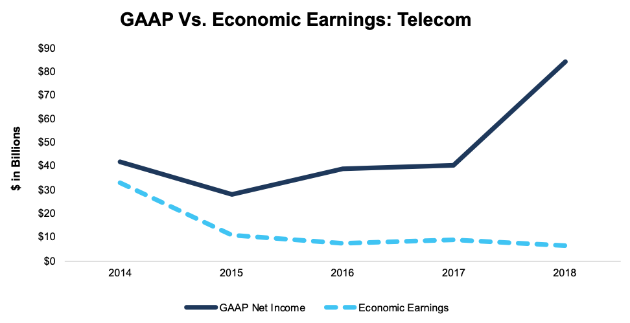
The Telecom sector earns its reputation as an oligopolistic industry. Three large companies in the industry –Verizon (NYSE:VZ), China Mobile (CHL) and Nippon Telegraph and Telephone (NTTYY) – earned $24.6 billion in positive economic earnings last year. The other 38 companies had a combined economic loss of $18 billion.
Figure 13: Economic vs. GAAP Earnings: Telecom
Sources: New Constructs, LLC and company filings.
Utilities Sector
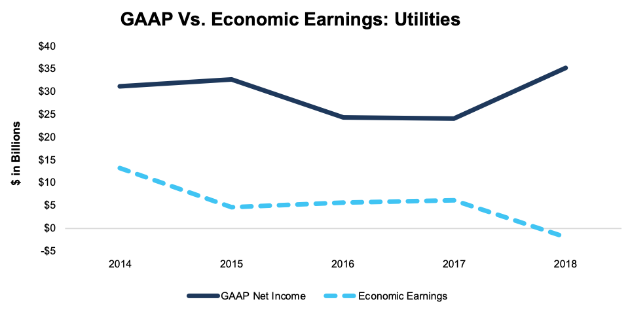
The Utilities sector is another sector with GAAP earnings growth in the double digits even as economic earnings turn negative.
Figure 13: Economic vs. GAAP Earnings: Utilities
Sources: New Constructs, LLC and company filings.
The Need for Diligence Has Arrived
The breadth of the decline in economic earnings should give investors pause. Even with tax cuts providing a tailwind, only Energy companies and a handful of big Technology firms managed to grow real profits last year.
Now more than ever investors need unconflicted and comprehensive fundamental research. Only by analyzing the footnotes and MD&A can one find companies that buck the trend of rising GAAP earnings and falling economic earnings. These are the stocks that will hold up when this bull market finally does come to an end.
This article originally published on April 16, 2019.
Disclosure: David Trainer and Sam McBride receive no compensation to write about any specific stock, style, or theme.
